

US traders have three reasons to be sad this week, writes Ian Murphy of MurphyTrading.com.
First of all, the holiday weekend was over and with it, the summer slumber in the markets officially ended. Second, Tuesday was the final day for many financial industry workers to return to the office as Covid-related work from home arrangements expired. And finally, the equity markets opened in a positive tone only to reverse as the session progressed and finish the day in the red—again!
Click charts to enlarge
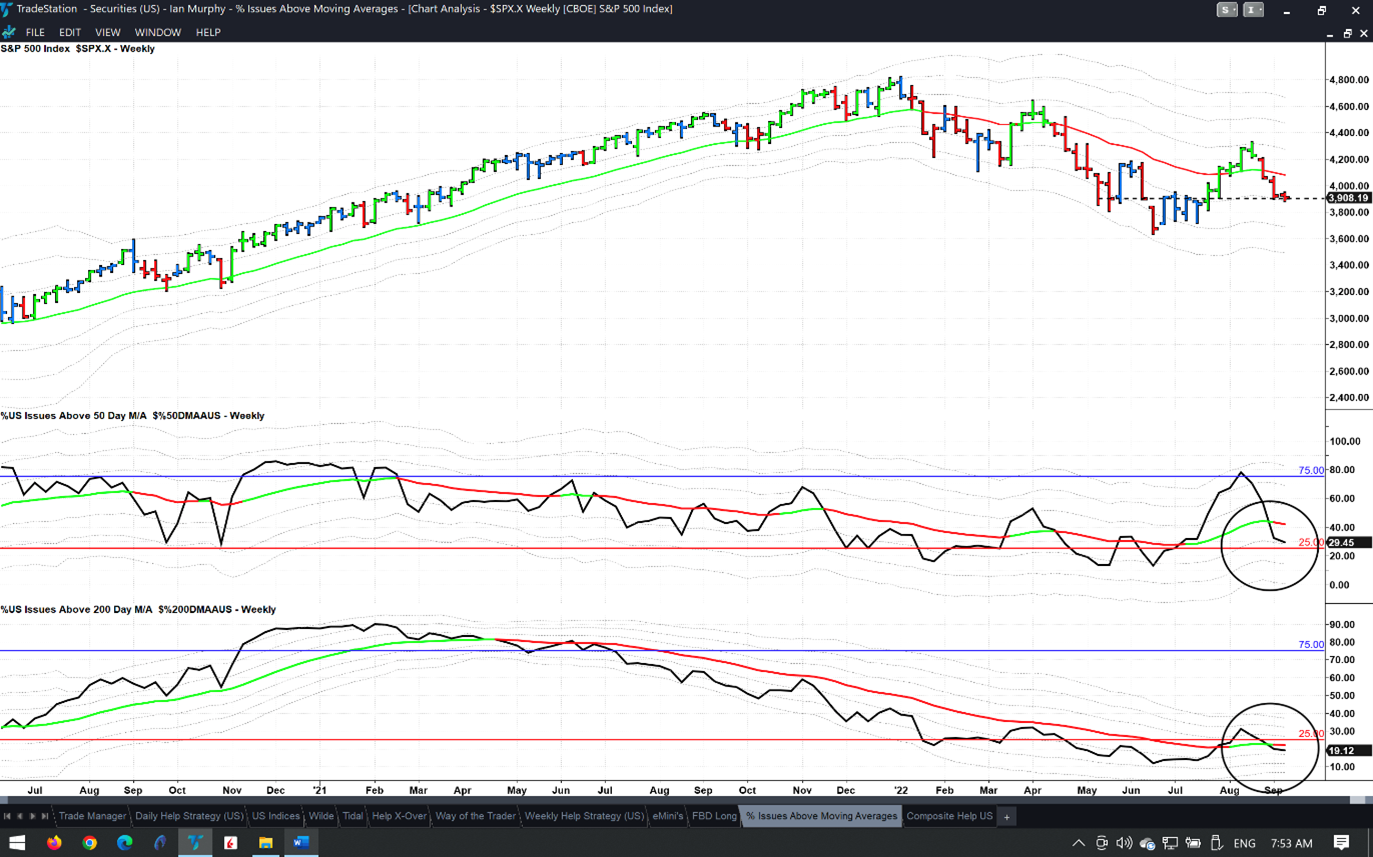
For the second week in a row, the S&P 500 (SPX) is testing support at the -1ATR line on a weekly chart. This coincides with horizontal support at 3900-ish. These support zones tend to be defined by a cluster of closing prices as highlighted by the black dashed line. A close below this zone will likely see the S&P 500 drawn further down to the 3600 area and June’s low.
Also note on the chart above, that only 19% of US stocks are trading above their 200-day moving average, while less than 30% are above the 50-day (circles). The 200-day is widely used by many investors who stay out of equities while the S&P 500 is trading below the line.
Click charts to enlarge
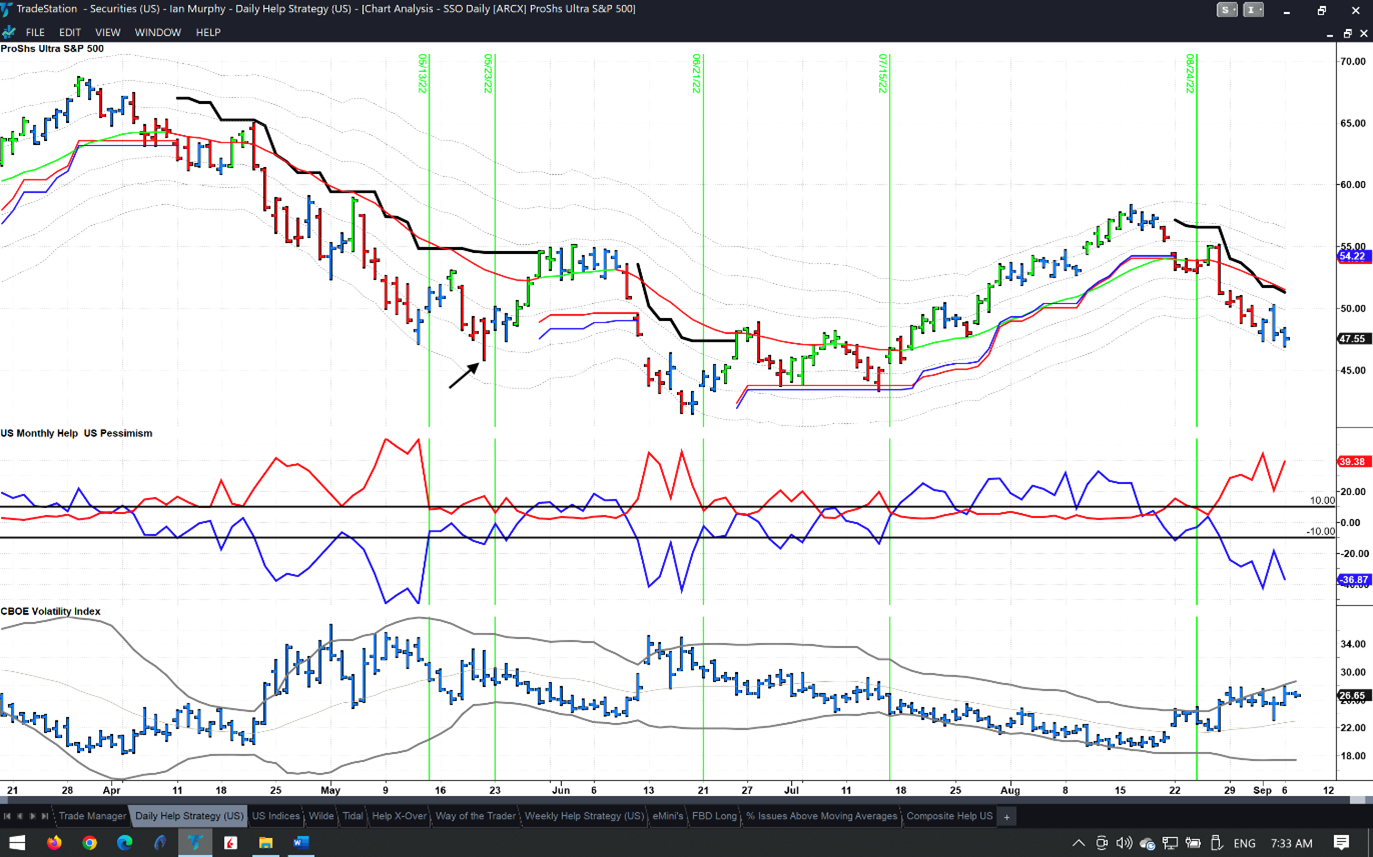
Regarding the Daily Help Strategy, I had an interesting discussion with a client yesterday who prefers to reverse long positions on the strategy rather than allow them to be stopped out. She uses a trailing stop on the short side (black line above) to manage the trades and never gets sad when stocks sell off.
The approach can be very profitable, but she has realized that you need to exit the short position at the EMA once the trade gets going because the drawdown can be enormous if you wait for the stop to be hit. For example, the low point on May 20 (arrow) had a drawdown of 18% when it rose to hit the stop, but the EMA was out a little sooner.
Learn more about Ian Murphy at MurphyTrading.com.


