

Stocks are in a severe short-term downtrend, spurred fundamentally by inflation and interest rates, says Lawrence McMillan of Option Strategist.
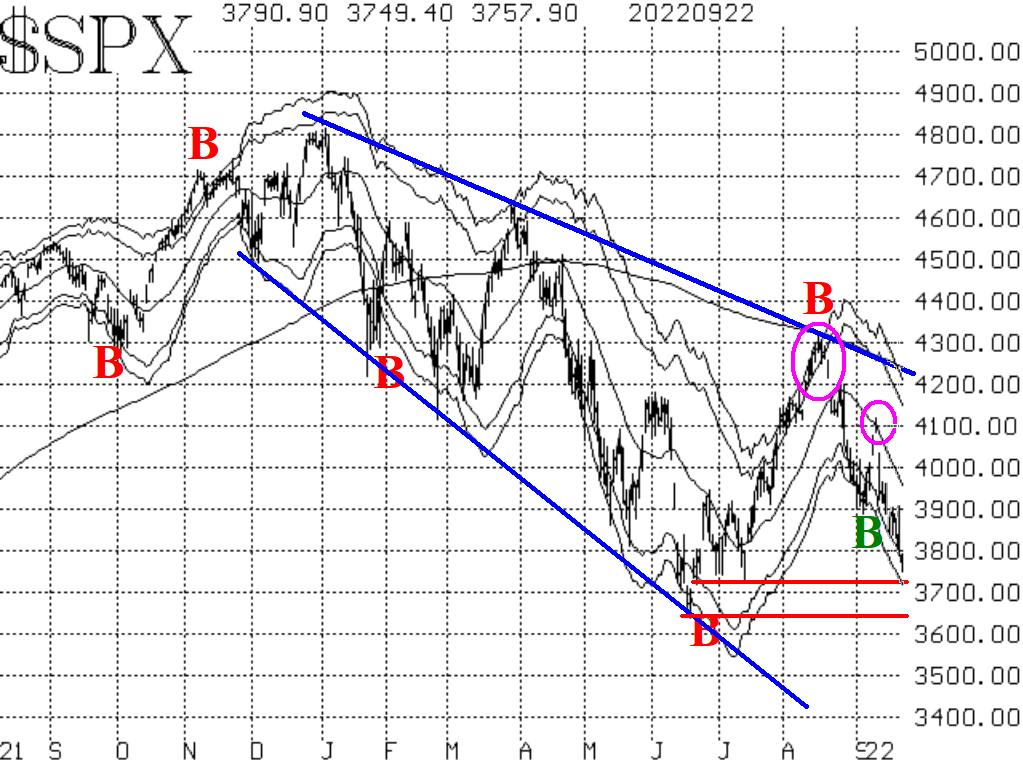
Technically, the S&P 500 (SPX) chart remains bearish in a number of ways. First and foremost, the downtrend lines on the SPX chart are stark evidence that this is a bear market. For that reason alone, one should maintain a "core" bearish position. There is support at 3637, the year-to-date lows, but if that is taken out, heavy selling could materialize quickly, creating an even more oversold condition.
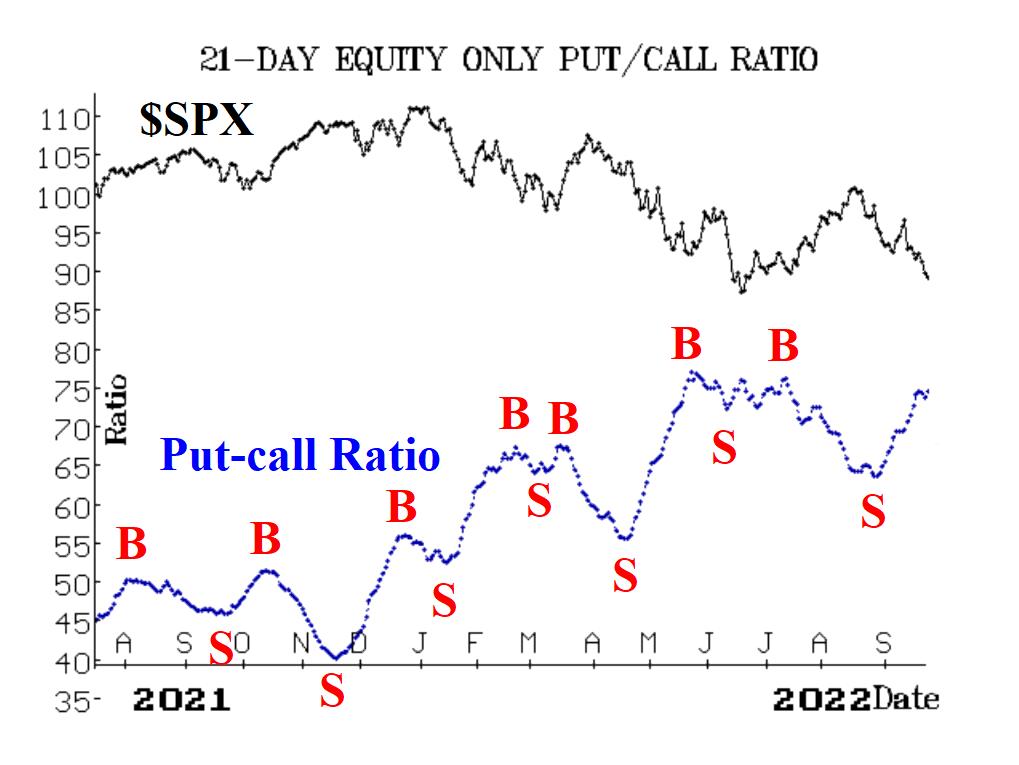
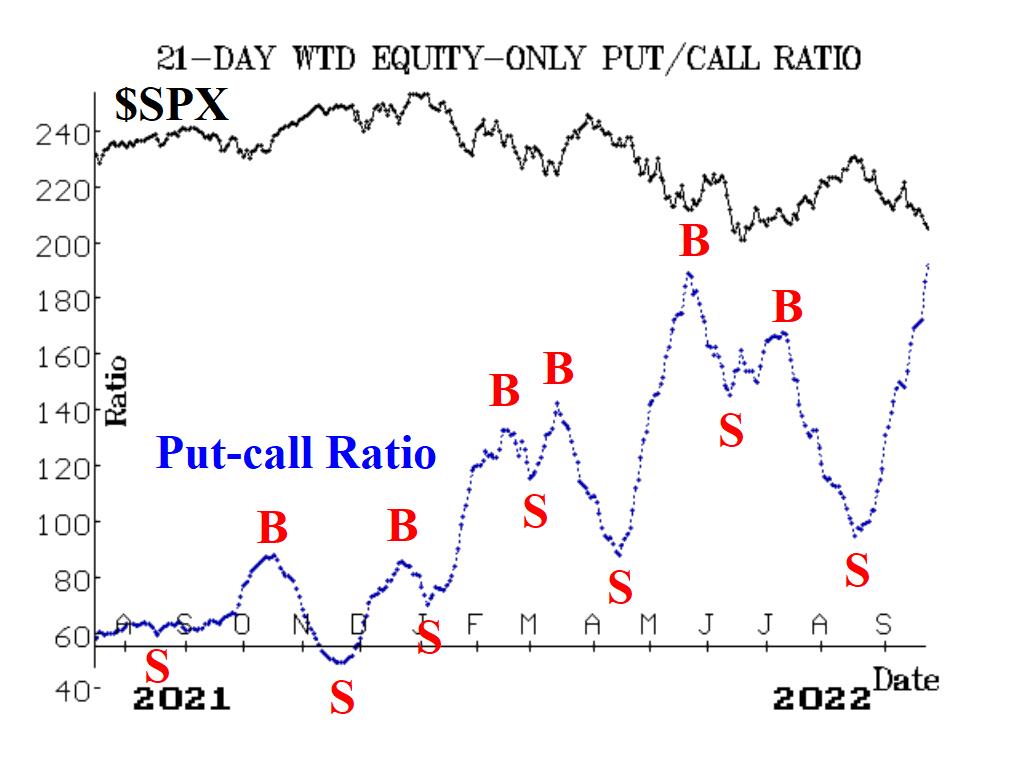
Equity-only put-call ratios continue to rise—especially the weighted ratio. That ratio in particular is now in deeply oversold territory; the standard ratio is making a new relative high but far less dramatically. Neither ratio has surpassed its late-May peak, but that is not out of the question. As oversold as these ratios are, they will not generate buy signals until they roll over and begin to trend downward.
Breadth has been horrendous in recent days and both breadth oscillators remain on sell signals. They are deeply into oversold territory, but it's going to take two or three days of positive breadth in order to generate buy signals from these oscillators.
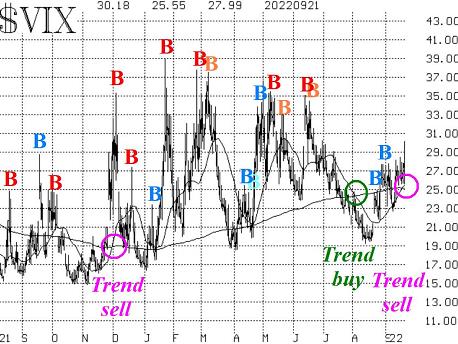
Cboe SPX Volatility Index (VIX) had been trying to generate some buy signals, and it still is. But it also has generated an important sell signal. When the 20-day Moving Average of VIX crossed above the 200-day MA on September 20, that confirmed a new trend of VIX sell signal, since VIX was also above the 200-day MA. At the same time, there is a possibility of a VIX "spike peak" buy signal in the near future. In summary, we are retaining our "core" bearish position and rolling it down where appropriate.
We will trade confirmed signals only, around our core bearish position. At the present time, that means we are ignoring the oversold conditions until they generate buy signals. Merely being oversold is not good enough.


