

Last week’s price action in the S&P 500 (SPX) was a reminder to resist the temptation to form opinions on the short-term direction of the market (long term is a different story), writes Ian Murphy of MurphyTrading.com.
This is easier said than done but we must go with what the price action is telling us.
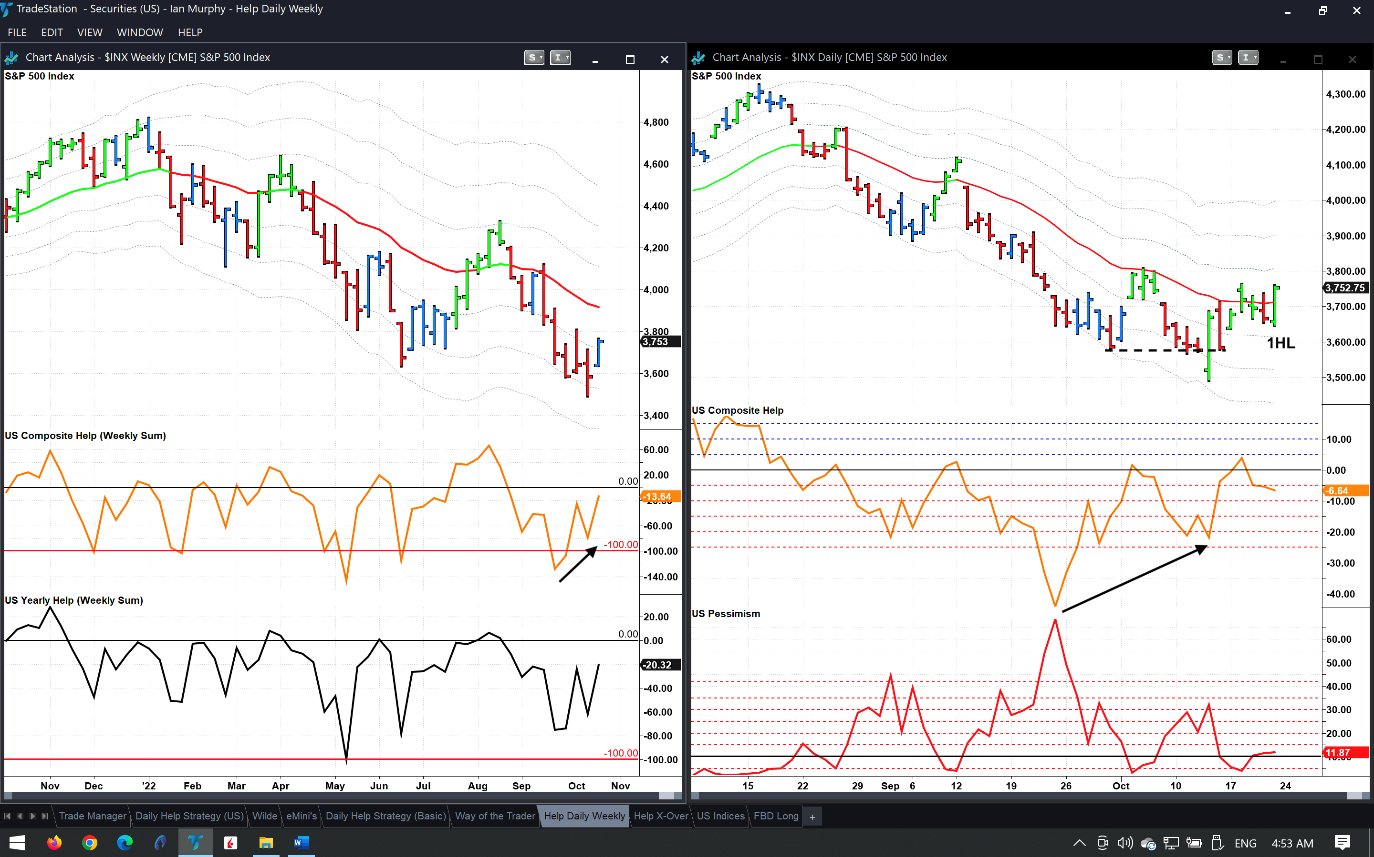
After Friday’s move, the S&P 500 formed a first higher low pattern above the -1ATR and this followed a false downside breakout in price (dashed line). The breakout was accompanied by a bullish divergence of the Composite Help indicator which tracks new highs and lows in all listed US stocks on three timeframes (black arrows). This is a classic bull pattern and is too powerful to ignore despite the economic headwinds and pessimistic commentary doing the rounds.
What people say and what they do, especially with their money, are two very different things. On Friday market participants were spending money and buying US stocks in large quantities.
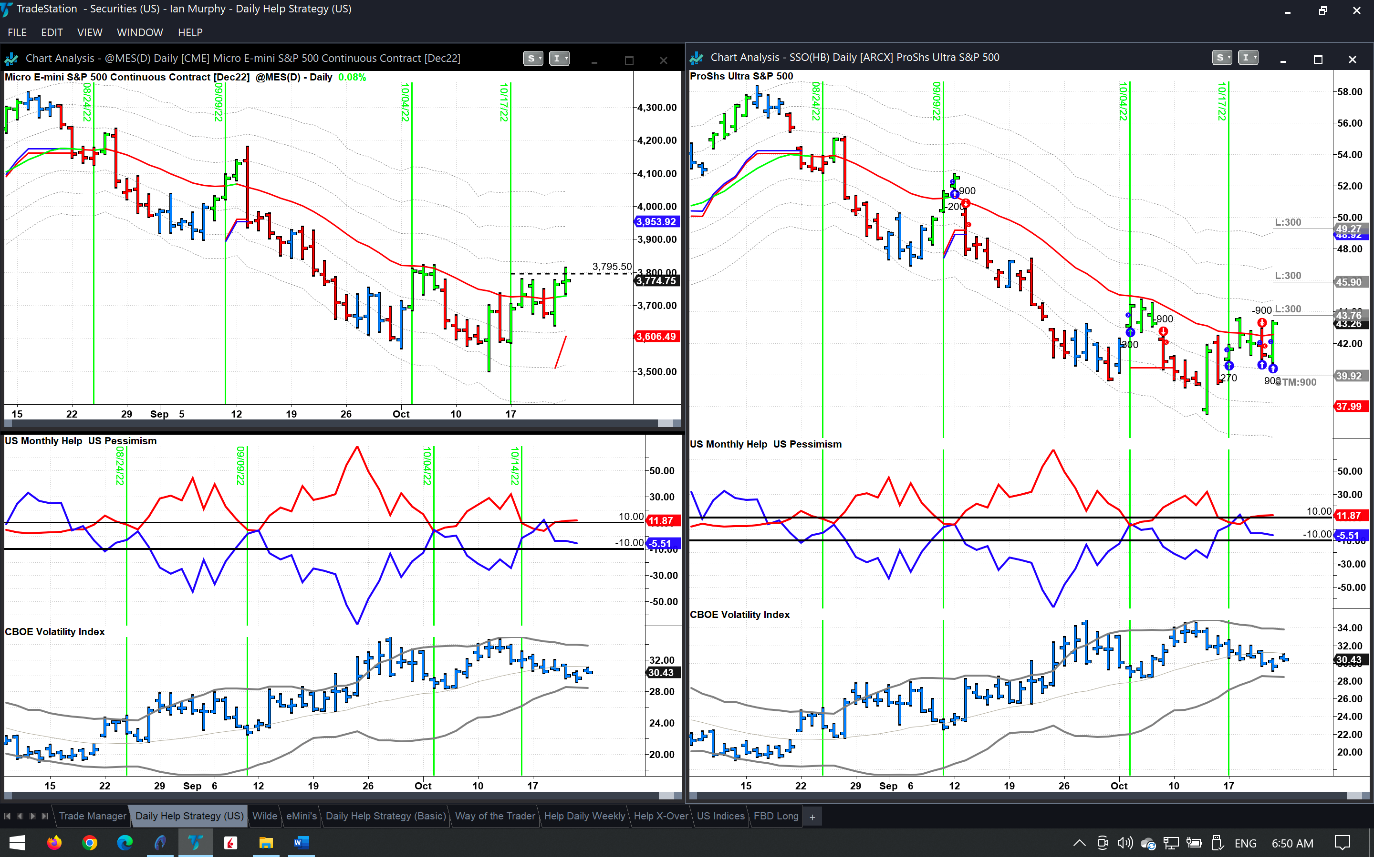
So, in my personal account, I re-entered a long position in SSO using the original protective stop and targets (right chart). In practice, this means I went from a long position to a short one (which I messed up) and back to a long one again the day after.
If we made on-off-on again decisions like this in everyday life it would appear as if we were totally confused. In the markets, this process is completely normal and goes to the heart of market psychology. The market is always right, and our job is to monetize the moves and we don’t always have to understand why they are happening.
In pre-market action, ProShares Ultra S&P500 2x Shares (SSO) are trading close to the first target, and the first target on Micro E-mini futures was hit almost immediately at the open yesterday evening (top left chart).
Learn more about Ian Murphy at MurphyTrading.com.


