

For today’s trade of the day we will be looking at a monthly chart for CIGNA Corp (CI), states Chuck Hughes of TradeWinsDaily.
Before breaking down CI’s monthly chart, let’s first review what products and services the company offers. Cigna Corporation provides insurance and related products and services in the United States. Its Evernorth segment provides a range of coordinated and point solution health services, including pharmacy, benefits management, care delivery and management, and intelligence solutions to health plans, employers, government organizations, and health care providers.
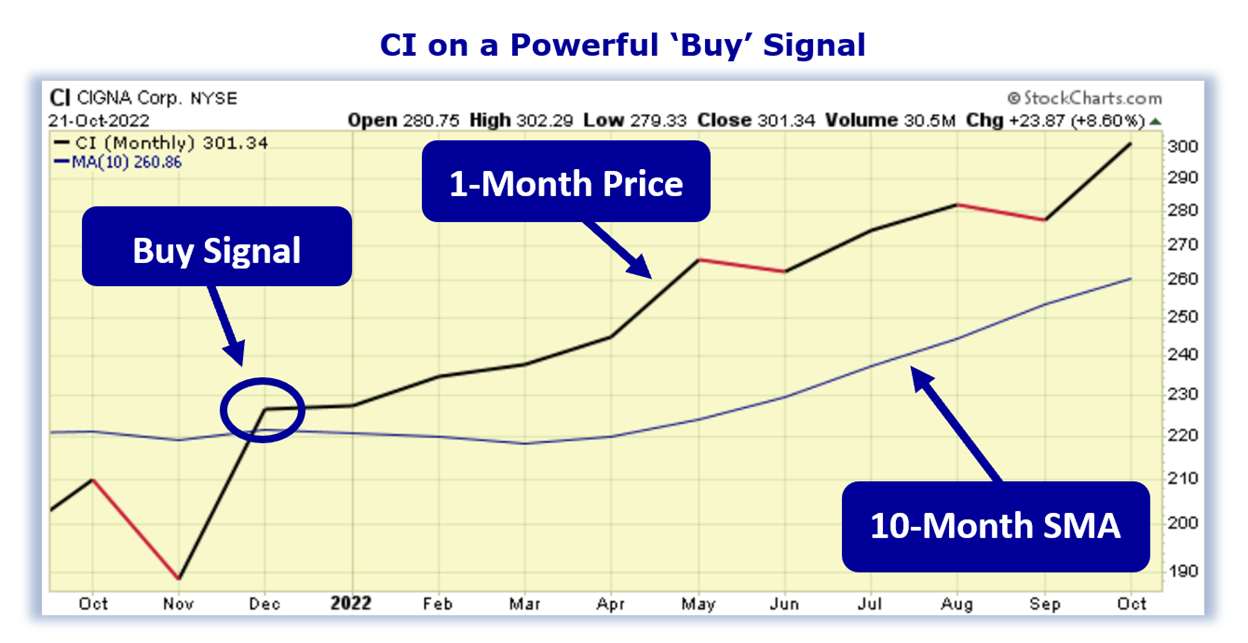
Now, let’s begin to break down the monthly chart for CI stock. Below is a ten-month simple moving average chart for CIGNA Corp.
Buy CI Stock
As the chart shows, in December 2021, the CI one-month price, crossed above the ten-month simple moving average (SMA). This crossover indicated the buying pressure for CI stock exceeded the selling pressure. For this kind of crossover to occur, a stock has to be in a strong bullish uptrend. Now, as you can see, the one-month price is still above the ten-month SMA. That means the bullish trend is still in play! As long as the one-month price remains above the ten-month SMA, the stock is more likely to keep trading at new highs and should be purchased. Our initial price target for CI is 315.00 per share.
Profit if CI is Up, Down, or Flat
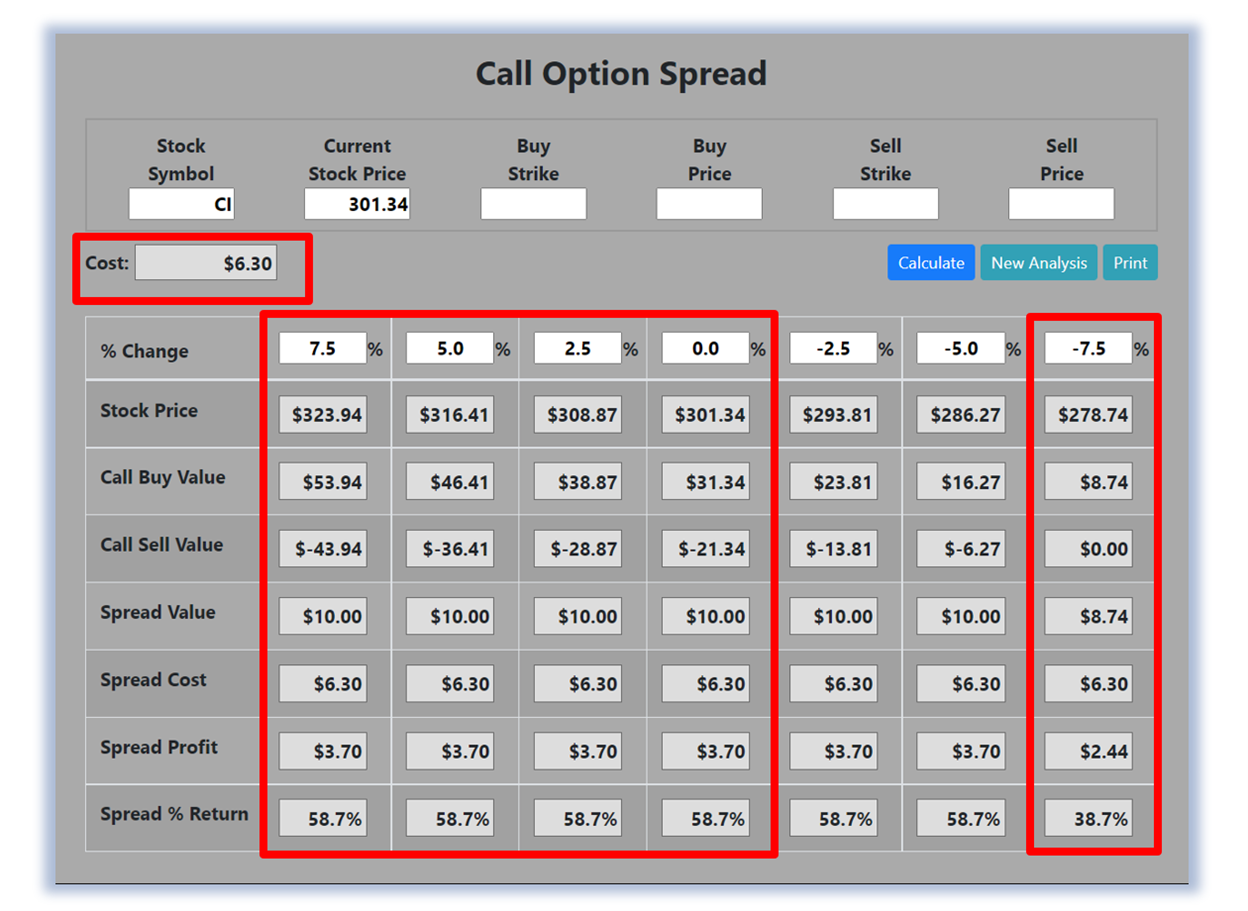
Now, since CI’s Monthly Price is currently trading above the ten-month SMA and will likely rally from here, let’s use the Hughes Optioneering calculator to look at the potential returns for a CI call option spread. The Call Option Spread Calculator will calculate the profit/loss potential for a call option spread based on the price change of the underlying stock/ETF at option expiration in this example from a 7.5% increase to a 7.5% decrease in CI stock at option expiration.
The goal of this example is to demonstrate the ‘built-in’ profit potential for option spreads and the ability of spreads to profit if the underlying stock is up, down, or flat at option expiration. Out of fairness to our paid option service subscribers, we don’t list the option strike prices used in the profit/loss calculation. The prices and returns represented below were calculated based on the current stock and option pricing for CI on 10/21/2022 before commissions.
Built-in Profit Potential
For this option spread, the calculator analysis below reveals the cost of the spread is $630 (circled). The maximum risk for an option spread is the cost of the spread. The analysis shows that if CI stock is flat or up at all at expiration the spread will realize a 58.7% return (circled). And if CI stock decreases 7.5% at option expiration, the option spread would make a 38.7% return (circled). Due to option pricing characteristics, this option spread has a ‘built-in’ 58.7% profit potential when the trade was identified*.
Option spread trades can result in a higher percentage of winning trades than a directional option trade if you can profit when the underlying stock/ETF is up, down, or flat. A higher percentage of winning trades can give you the discipline needed to become a successful trader. The Hughes Optioneering Team is here to help you identify profit opportunities just like this one.
Trade High Priced Stocks for $350 With Less Risk
One of the big advantages of trading option spreads is that spreads allow you to trade high-priced stocks like Amazon, Google, or Netflix for as little as $350. With an option spread, you can control 100 shares of Netflix for $350. If you were to purchase 100 shares of Netflix at current prices it would cost about $29,000. With the stock purchase, you are risking $29,000...but with a Netflix option spread that costs $350, your maximum risk is $350, so your dollar risk is lower with option spreads compared to stock purchases.
Average Portfolio Return of 239.9%
Below is a screenshot of the current open trade profit opportunities from Chuck’s Inner Circle Trading Service. There are currently $185,096.42 in open trade profit opportunities with an average portfolio return of 239.9% demonstrating the ability of the Optioneering Strategy to deliver substantial returns with no losing portfolios**.
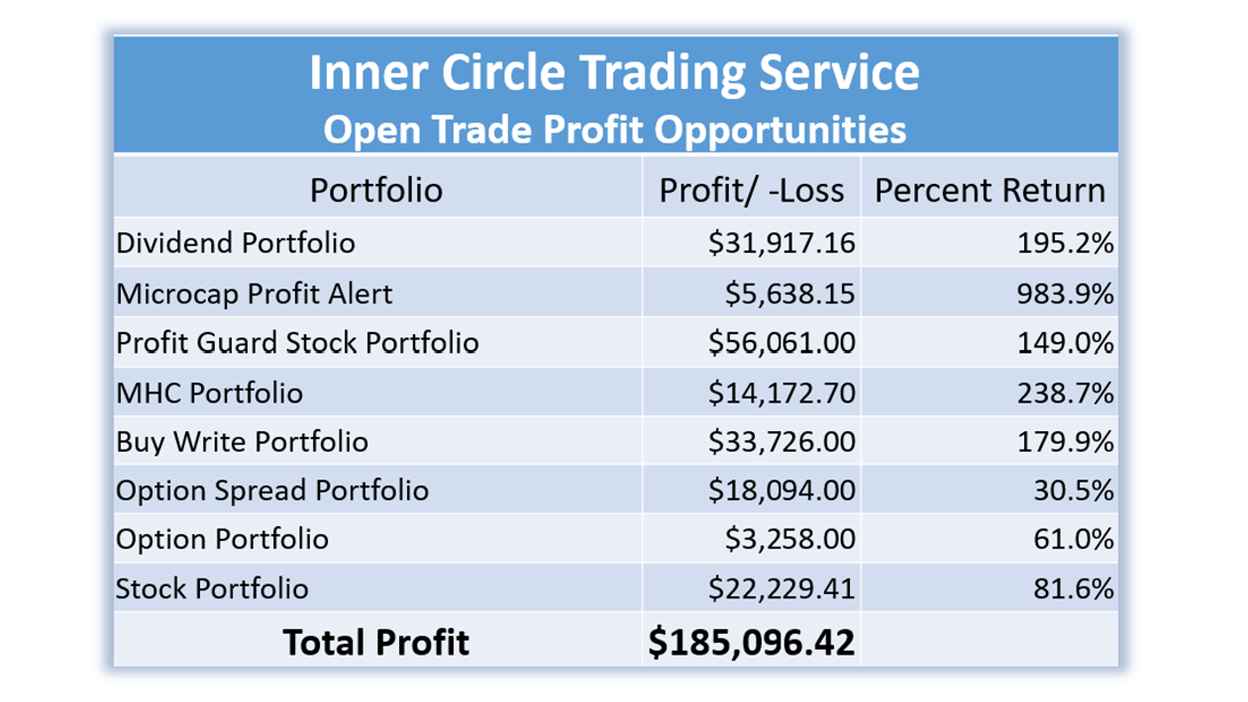
**Open trade profit results represent the open trade profit performance for the portfolio displayed on 10/21/22. Open trade profits may have increased or decreased when trades were closed out. Trading incurs risk and some people lose money trading. Past performance does not necessarily predict future results. Member profits and losses are not tracked. The profit potential is taken from signaled trades, not actual member results. Not all members make the trades.


