

If you’re into technical analysis, you probably understand my excitement each day when the stock market opens, notes Bob Lang of ExplosiveOptions.net.
Every session provides new data points that are completely different from the prior day, week, month, and year. Ranges fluctuate, price levels change, and news influences selling and buying behavior. It’s a new puzzle to figure out and analyzing stock charts is the only way to make sense of what’s happening.
Why Analyzing Stock Charts Is So Important
That analysis hinges on spotting patterns that repeat over and over again—and I love the challenge. Once you learn to spot the patterns, you can make assumptions about future actions by looking at the past. This is not guessing—far from it. Human behavior never changes, and it shows up in chart patterns. Learn to read the charts and find the patterns, and the odds are in your favor. I’ll take a strong probability over guessing any day of the week.
I often preach about the benefits of reading the charts and responding to patterns as they appear. Here’s a recent example of why that’s so important to your success as an options trader.
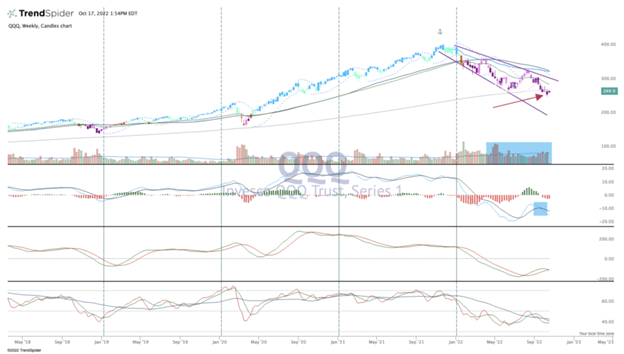
The Nasdaq recently fell below its weekly 200 moving average (ma)—see the big red arrow up top. This was a huge red flag because it was the first time in more than two years that this support line was crossed. Falling below the daily 200 ma is bad news in the short-term; falling below the weekly is a major concern for the long-term trend. In fact, the longer it stays below that line, the more resistant it will become to crossing back above it during rally attempts. When this happens, you can expect more downside.
The SPX 500 made a similar journey below the weekly 200 ma last week. This is another warning sign, and if there is a follow-through downward this week, you can also expect a long-term trend downward for this index.
Charts Provide Unbiased Information—Use It
In the end, the charts are going to tell you where we were while feeding you information about the future. If you trust the charts to give you accurate information, use them to your advantage. They matter, especially in these volatile times.
Learn more about Bob Lang at ExplosiveOptions.net.


