

For today’s trade of the day we will be looking at an On Balance Volume chart for QUALCOMM Incorporated (QCOM), states Chuck Hughes of TradeWinsDaily.
Before breaking down QCOM’s OBV chart let’s first review which products and services are offered by the company.
QUALCOMM Incorporated engages in the development and commercialization of foundational technologies for the wireless industry worldwide. The company operates through three segments: Qualcomm CDMA Technologies; Qualcomm Technology Licensing; and Qualcomm Strategic Initiatives. The QCT segment develops and supplies integrated circuits and system software based on 3G/4G/5G and other technologies for use in wireless voice and data communications, networking, application processing, multimedia, and global positioning system products.
Confirming a Price Downtrend with OBV
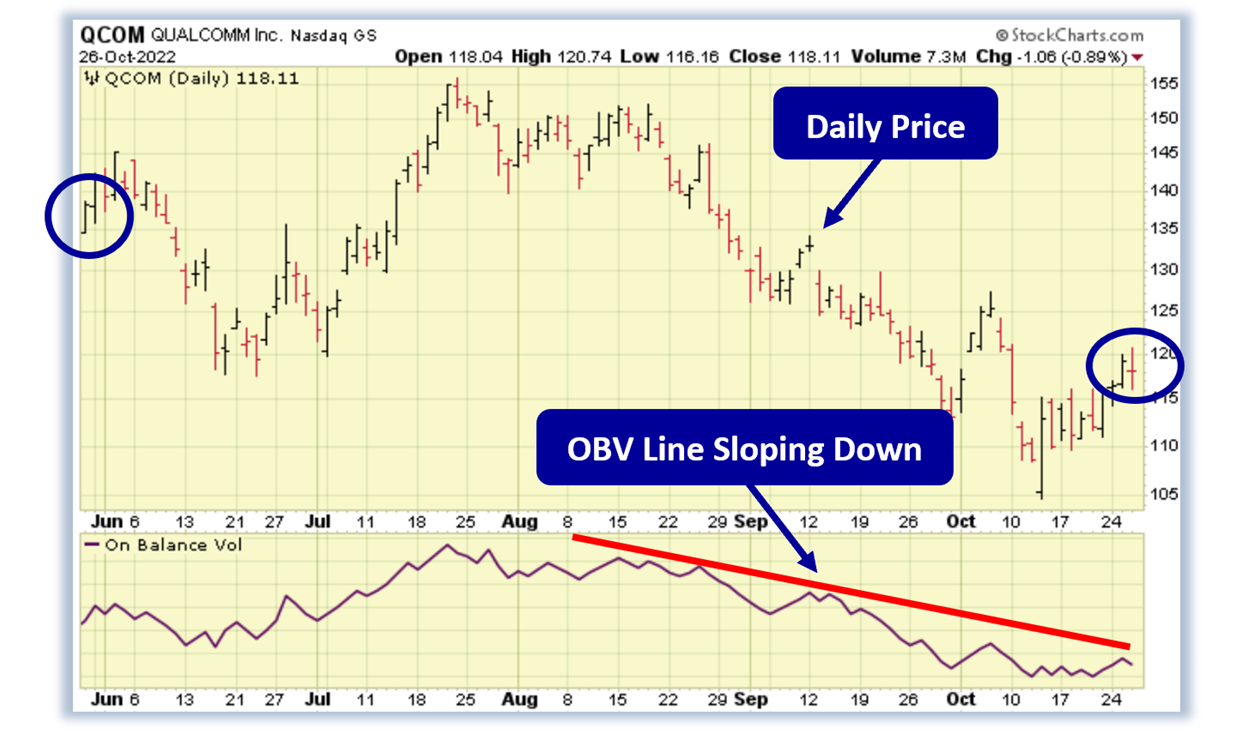
The QCOM daily price chart below shows that QCOM is in a price downtrend as the current price is below the price QCOM traded at five months ago (circled). The On Balance Volume chart is below the daily chart.
On Balance Volume measures volume flow with a single easy-to-read line. Volume flow precedes price movement and helps sustain the price downtrend. When a stock closes up, volume is added to the line. When a stock closes down, volume is subtracted from the line. A cumulative total of these additions and subtractions form the OBV line.
On Balance Volume Indicator
- When Close is Up, Volume is Added
- When Close is Down, Volume is Subtracted
- A Cumulative Total of Additions and Subtractions from the OBV Line
Volume flow precedes price and is the key to measuring the validity and sustainability of a price trend.
We can see from the OBV chart below that the On Balance Volume line for QCOM is sloping down. A down-sloping line indicates that the volume is heavier on down days and selling pressure is exceeding buying pressure. Selling pressure must continue to exceed buying pressure in order to sustain a price downtrend. So, On Balance Volume is a simple indicator to use that confirms the price downtrend and its sustainability.
The numerical value of the On Balance Volume line is not important. We simply want to see a down-sloping line to confirm a price downtrend.
Confirmed ‘Sell’ Signal for QCOM
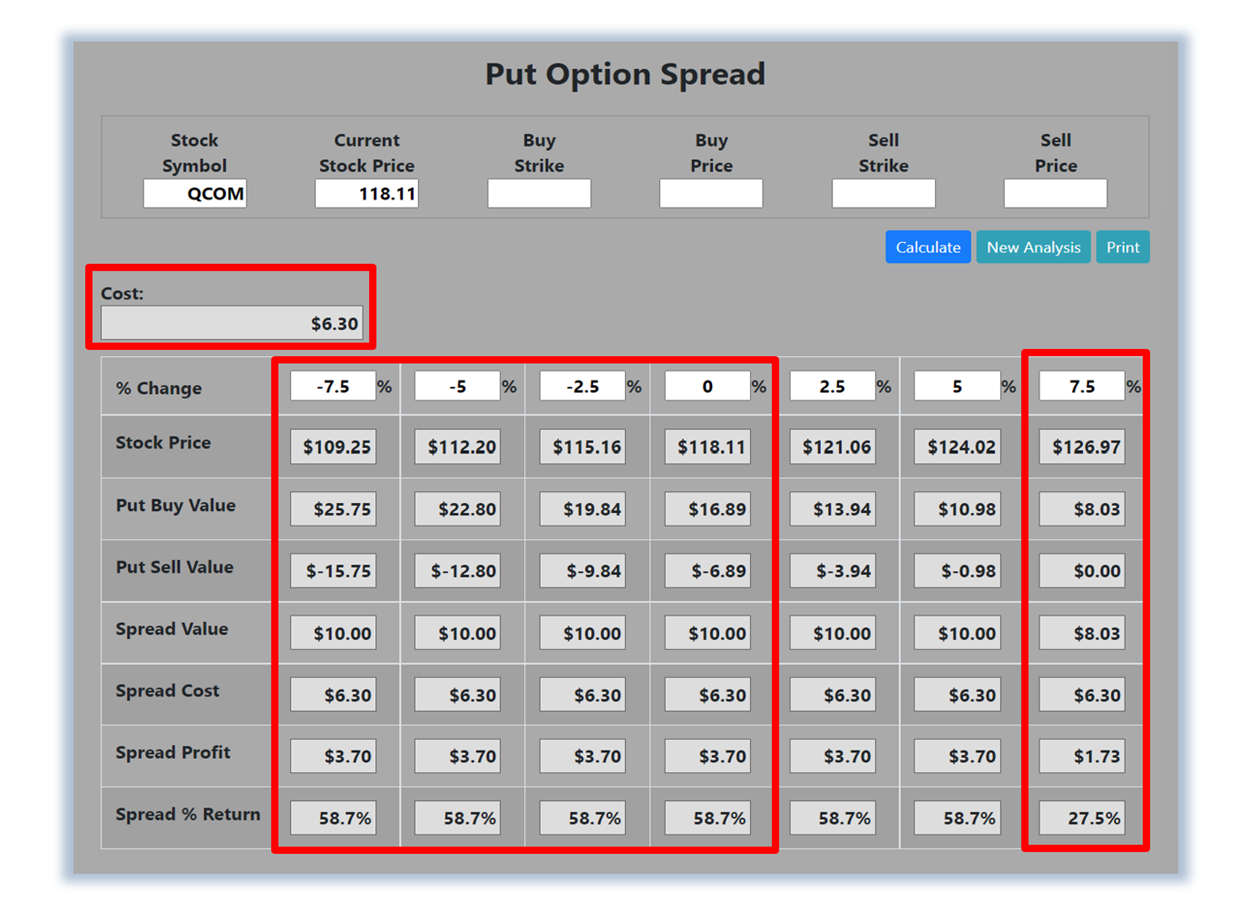
Since QCOM's OBV line is sloping down, the most likely future price movement for QCOM is down, making QCOM a good candidate for a put option debit spread. Let's use the Hughes Optioneering calculator to look at the potential returns for a QCOM debit spread. The Put Option Spread Calculator will calculate the profit/loss potential for a put option spread based on the price change of the underlying stock/ETF at option expiration in this example from a 7.5% decrease to a 7.5% increase in QCOM stock at option expiration.
The goal of this example is to demonstrate the ‘built-in’ profit potential for option spreads and the ability of spreads to profit if the underlying stock is down, up, or flat at option expiration. Out of fairness to our paid option service subscribers, we don’t list the option strike prices used in the profit/loss calculation. The prices and returns represented below were calculated based on the current stock and option pricing for QCOM on 10/26/2022 before commissions.
Built-in Profit Potential
For this option spread, the calculator analysis below reveals the cost of the spread is $630 (circled). The maximum risk for an option spread is the cost of the spread. The analysis reveals that if QCOM stock is flat or down at all at expiration the spread will realize a 58.7% return (circled). And if QCOM stock increases 7.5% at option expiration, the option spread would make a 27.5% return (circled). Due to option pricing characteristics, this option spread has a ‘built-in’ 58.7% profit potential when the trade was identified*.
Option spread trades can result in a higher percentage of winning trades compared to a directional option trade if you can profit when the underlying stock/ETF is up, down, or flat. A higher percentage of winning trades can give you the discipline needed to become a successful trader. The Hughes Optioneering Team is here to help you identify profit opportunities just like this one.
Trade High Priced Stocks for $350 With Less Risk
One of the big advantages of trading option spreads is that spreads allow you to trade high-priced stocks like Amazon (AMZN), Google (GOOGL), or Netflix (NFLX) for as little as $350. With an option spread, you can control 100 shares of Netflix for $350. If you were to purchase 100 shares of Netflix at current prices it would cost about $29,000. With the stock purchase, you are risking $29,000 but with a Netflix, option spread those costs $350 your maximum risk is $350 so your dollar risk is lower with option spreads compared to stock purchases.


