

When a week begins on Halloween (as this one did) we can expect a few surprises. Hopefully, they won’t be too horrific, writes Ian Murphy of MurphyTrading.com.
Today’s interest rate announcement and press conference at the Fed is getting all the attention as market watchers look for signs of a ‘pivot’ to lower rate hikes, but there is a plethora of other potentially scary events going on in the background also.
The flow of earnings announcements from listed companies will increase significantly as the week progresses and reaches a climax next week. According to Tajinder Dhillon at Refinitiv, 54% of firms in the S&P 500 (SPX) have reported earnings and 73% have come in above expectations. That goes some way to explaining the recent bounce in US stocks despite the economic headwinds.
The Bank of England announces its latest rate decision on Thursday as the independence of that central bank was tested during the country’s recent political drama. Another sizable rate hike in the face of a struggling economy will not endear the bank with the country’s borrowers.
Getting back to the Fed’s meeting where they will announce interest rates at 14:00 ET, the expected "pivot" is supposed to occur when the Fed stops front-loading large increases in the order of 0.75% and ease back to ‘normal’ hikes of 0.25%. That will happen when the bank sees that consumers have stopped spending because they can’t afford to—a classic case of bad news for the real economy might be good news for the markets.
The 52-Week Strategy
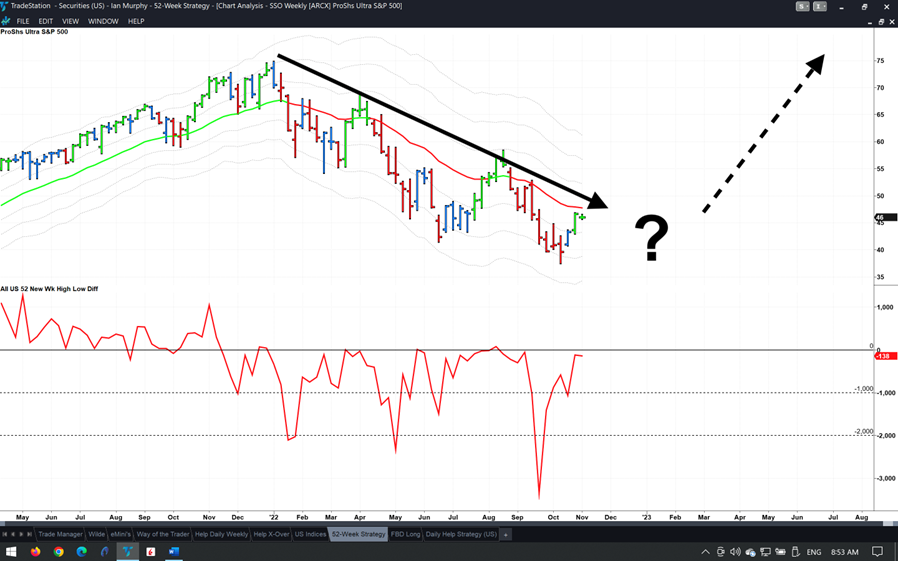
Against the backdrop of the events mentioned above traders and investors are looking forward to when equity markets will finally bottom out and the next bull market begins. As always, we should leave the predictions to someone else and devote our time to looking for concrete signs that the bottom is in. Keep reading, because today I am introducing a new strategy that has been specifically designed to identify when the market cycle has changed.
As you know I am a great believer in making the effort to count the number of stocks making new highs and new lows on different time frames to get a deeper insight into what’s happening and to get a step ahead of a market move before it occurs. Unfortunately, that level of analysis takes time, and many amateur traders and investors may not have much time to give.
With that in mind, we developed a new strategy that maintains the advantages of using new highs and lows but dispenses with the depth of detail that part-time investors and traders don’t require. The strategy works by measuring the difference between US stocks making 52-week highs and lows, and when the balance shifts from one to the other we open or closes a position.
The data for the strategy is freely available online and is also offered as an indicator by many trading platforms. This weekly trend-following strategy is simple and uncluttered and can be traded on a highly liquid ETF or futures contracts which offer a pure play on the US equity market so there is no need to scan watchlists for stocks. You don’t even have to use a chart, the entry signals can be taken using the raw data.
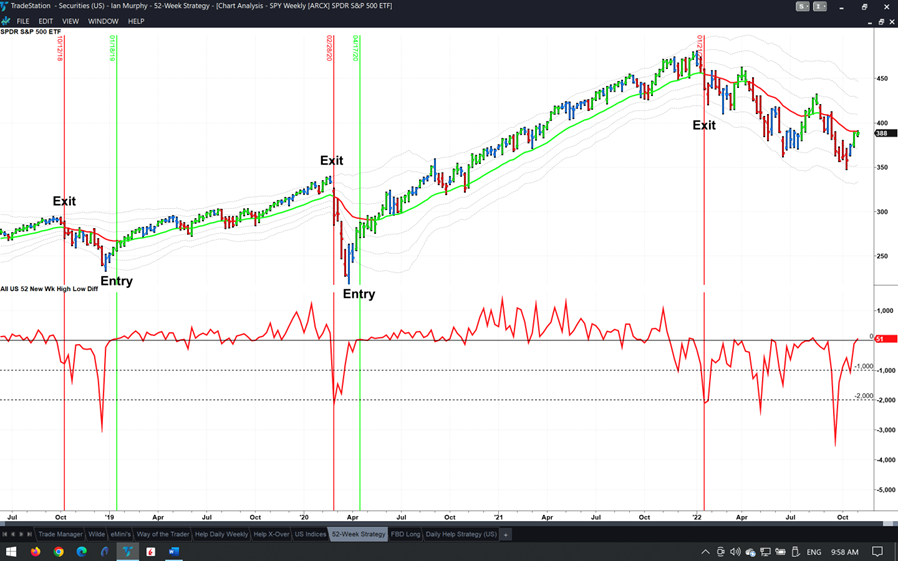
Most important of all, this 52-Week Strategy produced a gain of 53% from April 2020 to Jan 2022 on the highly liquid but pedestrian SPY ETF (shown above), whereas SSO gave 128% over the same period for those who are prepared to embrace a geared instrument.
The strategy will be explained in detail during Thursday’s Client Webinar, and over the coming weeks (or months) the next entry signal will be shared with newsletter readers when it happens.
Help Strategy
Four years ago, this strategy was introduced in Way of the Trader, and it continues to produce regular nuggets of profit like the proverbial golden goose. Admittedly this year’s bearish trend required a switch from taking final profits in one lump on a trailing stop to scaling out at ATR targets, but the strategy is still catching short-term bounces and delivering healthy gains.
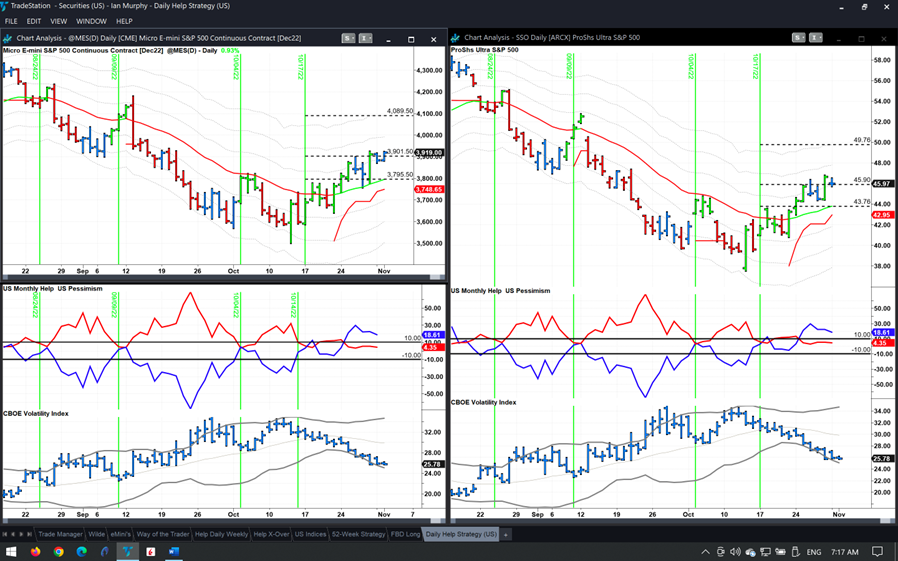
The current trigger on the ProShares 2x geared ETF (SSO) was activated just three days after the mid-month review was sent out, and it had gained 10.5% by yesterday’s close. This is the 145th trigger on SSO since 2006 and the first two targets have been hit (black dashed lines, right chart). ⅔ of the original position has been scaled out by now and the final target is at the 3ATR line on SSO which is currently at $49.76, and the trailing stop has moved up to $42.95.
On Micro E-mini futures the same trigger has also reached the first two targets (left chart) and the trailing stop on the final contract has moved up to 3748.75 (rounded to the nearest 0.25).
Learn more about Ian Murphy at MurphyTrading.com.


