

What a week! We’ve had crypto carnage (which is still unfolding), midterm elections (which are still being counted), inflation data (which might be slowing), and mass layoffs in the tech sector (which is unprecedented), writes Ian Murphy of MurphyTrading.com.
Not surprisingly equity markets whipsawed up and down leaving confusion in their wake, but a subtle trend change may be taking place under the surface.
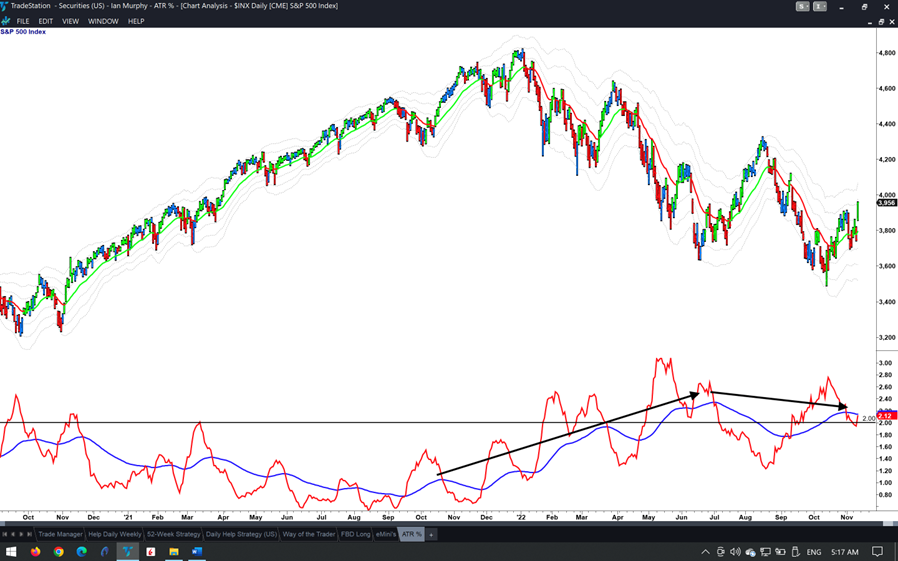
Average True Range Percent (ATR%) measures the unique realized volatility of an instrument. In other words, how much is it jumping up and down now compared to how much it usually jumps? A broad-based equity index such as the S&P 500 (SPX) remains below 2% in a bull market and rises above that level (black line) in a bear market. By watching for a crossover of this threshold, we can get a heads-up on a trend change.
The selloff and recovery in October and November have been accompanied by falling ATR% (black arrows) and falling volatility is one of the six signs of a trend change.

The Help Strategy hit the first target yesterday on Micro E-mini futures and ProShares Ultra S&P500 2x Shares (SSO), but not before coming within 46c of being stopped out on SSO. In my personal account, I scaled out ⅓ of the original 900 shares at the first target and removed the second target on SSO before the opening. This trade is now in profit, and I’m prepared to give the remaining 600 shares a chance to run.
Learn more about Ian Murphy at MurphyTrading.com.


