

With midterm elections in the can, what can investors expect next for markets? History paints with a green brush. Here’s your post-midterm election stock market gameplan, says Lucas Downey of Mapsignals.com.
Let’s rewind a bit. Back in August, I put together a midterm election stock market playbook. In it, I showed how heading into the election, markets follow strong seasonal patterns:
- Expect weak September performance
- Expect strong October and November performance
- Expect BMI to dip into October and rise in November
Those expectations were actually quite accurate. The S&P 500 (SPX) fell 9.3% in September and rose 8% in October. The BMI plunged into oversold in October, with a sharp rise into November.
The S&P 500 is down 3.2% MTD. So, this part of the playbook hasn’t gone as planned...yet. But there’s still plenty of time for the market to rebound. All in all, I’m pleased with the results! However, the million-dollar question is, what happens next? History points to more seasonal strength over the next few months. And we should expect more upside in the BMI as well. Let’s get to it.
Post-Midterm Election Stock Market Gameplan
In 2022, you’ve probably learned that markets hate uncertainty. Rising rates, hawkish fed, big inflation, wars, and more have unsettled investors. Add election anxiety to the mix too. But get this, history points to incredibly bullish markets in the months after a midterm election. And there’s more—the following year boasts big average gains.
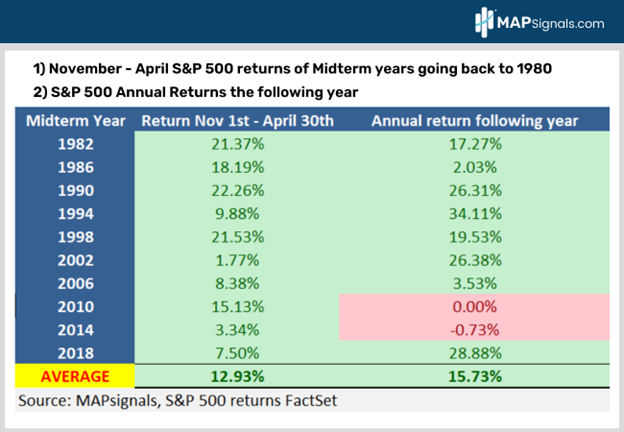
For this study, I looked at all midterm election years going back to 1980, roughly 40 years. I asked two questions. First, how does the market perform from November first–April 30? That’s around six months post every midterm election. Second, how do stocks perform the year following a midterm election year?
Below are the results. Remarkably, in the ten prior midterm election years, November to April saw the S&P 500 positive in all instances, with an average gain of nearly 13%. Even more, the following year shows an average jump of just under 16%:
That’s a ton of green! Basically, four decades of data hint at brighter days in the coming months. That’s a message I’m sure many would welcome! But let’s take this information a step further. With all that green above, you’d expect big inflows into stocks accompanying that climb. In general, that’s the case.
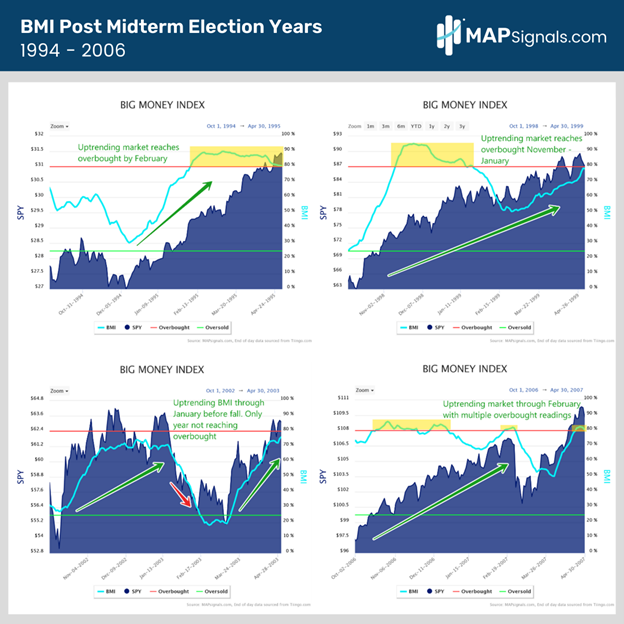
Let’s look at some Big Money Index history. Below is a snapshot of the BMI in midterm election years from 1994–2006. Notice two things: stocks are in an uptrend and the BMI reached overbought in three out of four instances. Only 2002–2003 didn’t see the BMI trigger a red signal:
Now let’s review the years 2010–2018. A similar pattern emerges. Stocks climb, and in all three instances, the BMI reaches overbought. Check it out:
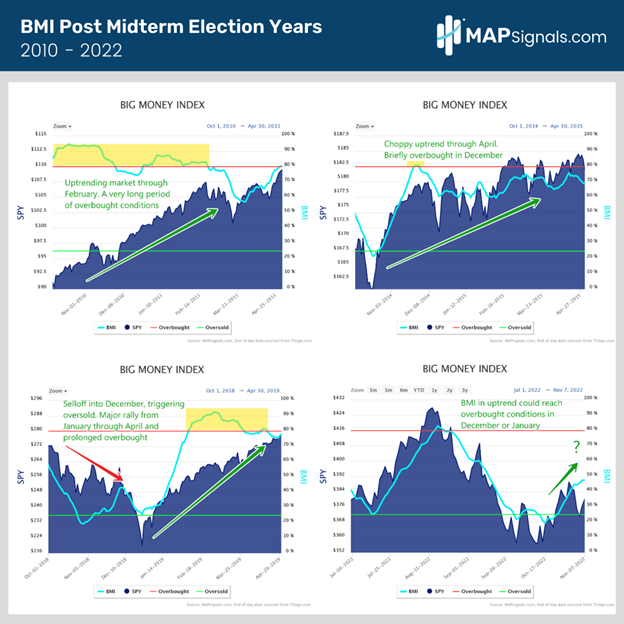
You’ll also notice, in the bottom right, a chart of the BMI today. After triggering oversold in October, it has vaulted to 45%. That’s mainly due to big chunky buying in energy and healthcare stocks in the last few weeks. Based on history, we should expect a visit to the red zone in the coming months. The post-midterm election stock market game plan says the odds for higher market prices are in the bulls’ favor.
Let’s wrap up.
Here’s the bottom line: Seasonal trends point to a tailwind for stocks. November–April following a midterm election, are extremely bullish. Since 1980, markets are higher in all instances with an average gain of 12.93%.
The following year, stocks jumped an average of 15.73%. Add to it, the BMI has a six out of seven chance of reaching overbought in the coming months. There’s no guarantee that 2022 will follow this playbook. The macro landscape is as murky as ever. But there’s no question history favors the optimistic!
To learn more about Lucas Downey, visit Mapsignals.com.


