

Dow Theory is something that gets thrown around a lot, usually irresponsibly, explains JC Parets of AllStarCharts.com.
What I mean is, that there is a lot more to Dow Theory that what you normally hear about on the TV or read about on the Internet. Usually, conversations about Dow Theory revolve around the Dow Jones Industrial Average and Dow Jones Transportation Average either confirming or not confirming each other’s trends. This is indeed part of Dow Theory, but not even in my top five most important Dow Theory Tenets. There are other aspects of Dow Theory that we need to pay attention to even more.
Stock Market Averages
The idea behind stock market indexes came from Charlie Dow. He created the Dow Jones Industrial Average (the companies that produce the goods) and the Dow Jones Railroad Average (the companies that deliver the goods). Now known as the Dow Jones Transportation Average, these two indexes remain a great gauge of the overall health of the stock market even to this day. When one of the two indexes makes a new closing high within an uptrend, the other one should too, or do so within a relatively short amount of time, days, or weeks. If this does not occur, and one index makes a new high while the other one diverges, we get a warning flag about the ongoing trend.
It’s the same thing on the way down. If one of the two Dow Jones Averages is making new lows in a downtrend, the other one should be confirmed very soon. When it doesn’t, that’s a heads-up that something could be changing. Once prices start to make higher highs, and the other index does as well, then we have a confirmed reversal in trend.
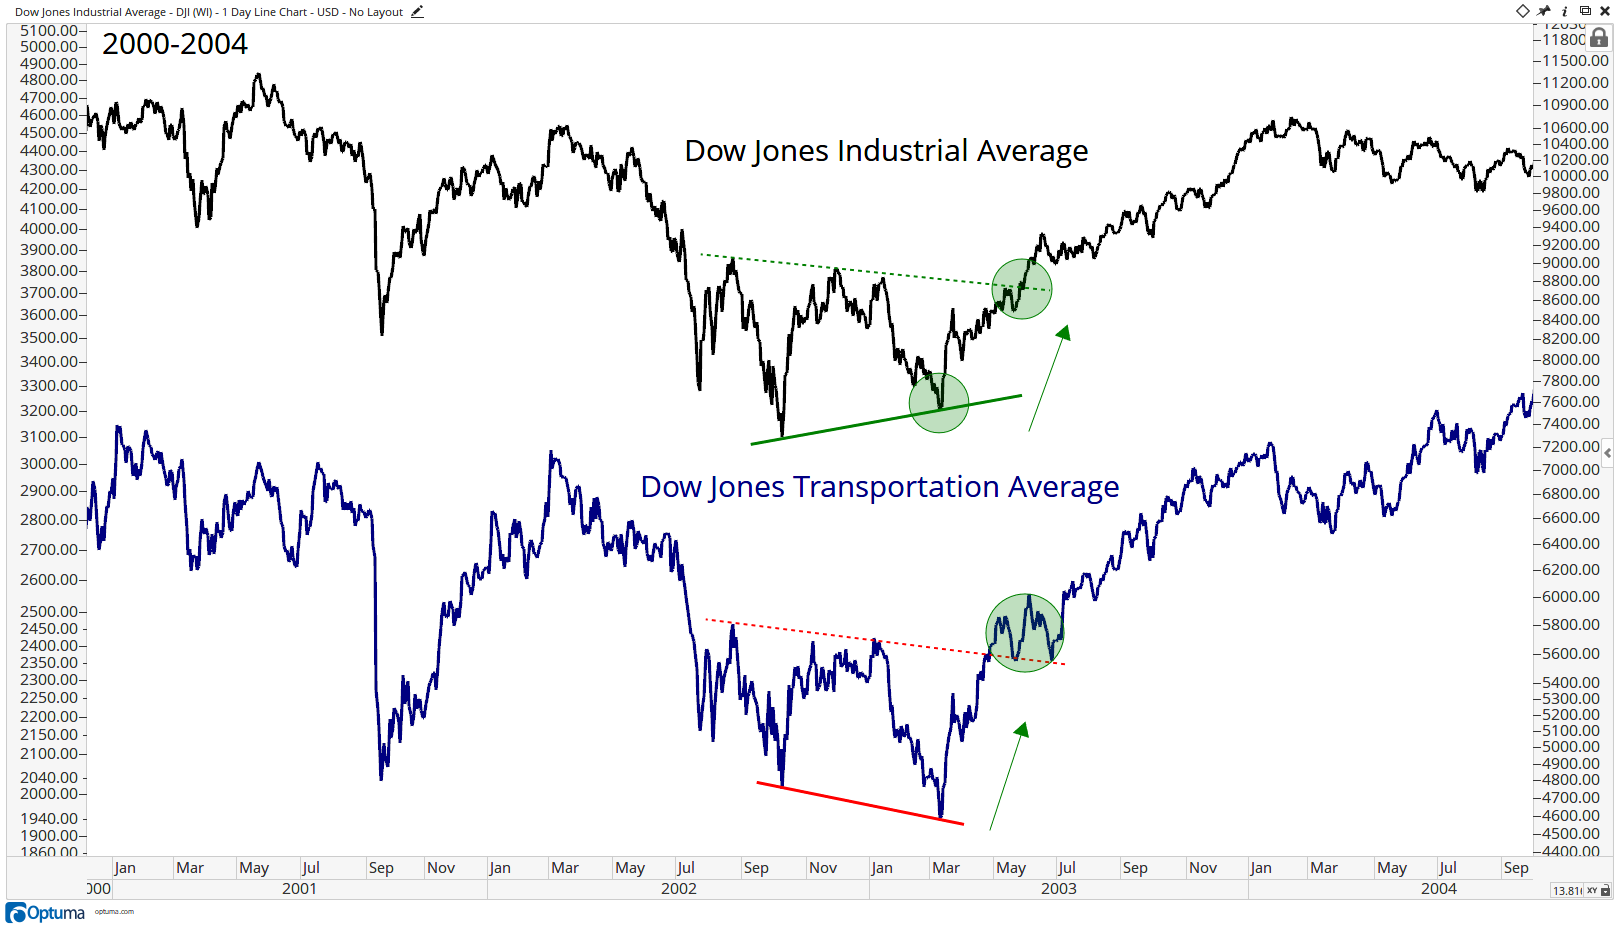
Here is an example of the Dow Jones Transportation Average making a lower low into March of 2003 while the Dow Jones Industrial Average was making a higher low. This bullish divergence was evidence of a change in trend. Not a reversal, but a change. Once both indexes broke out from their respective bases in May of that year, it signaled that the trend was now up:
Rewind just a few years prior and you can see what occurred in early 2000. Look what took place just as one of the most historic market crashes was getting ready to start. The Dow Jones Industrial Average put in new highs during the first couple of weeks of the new millennium, but the Dow Transports were already down over 16% from their most recent highs. This was not just a small divergence; it was a monster signal:
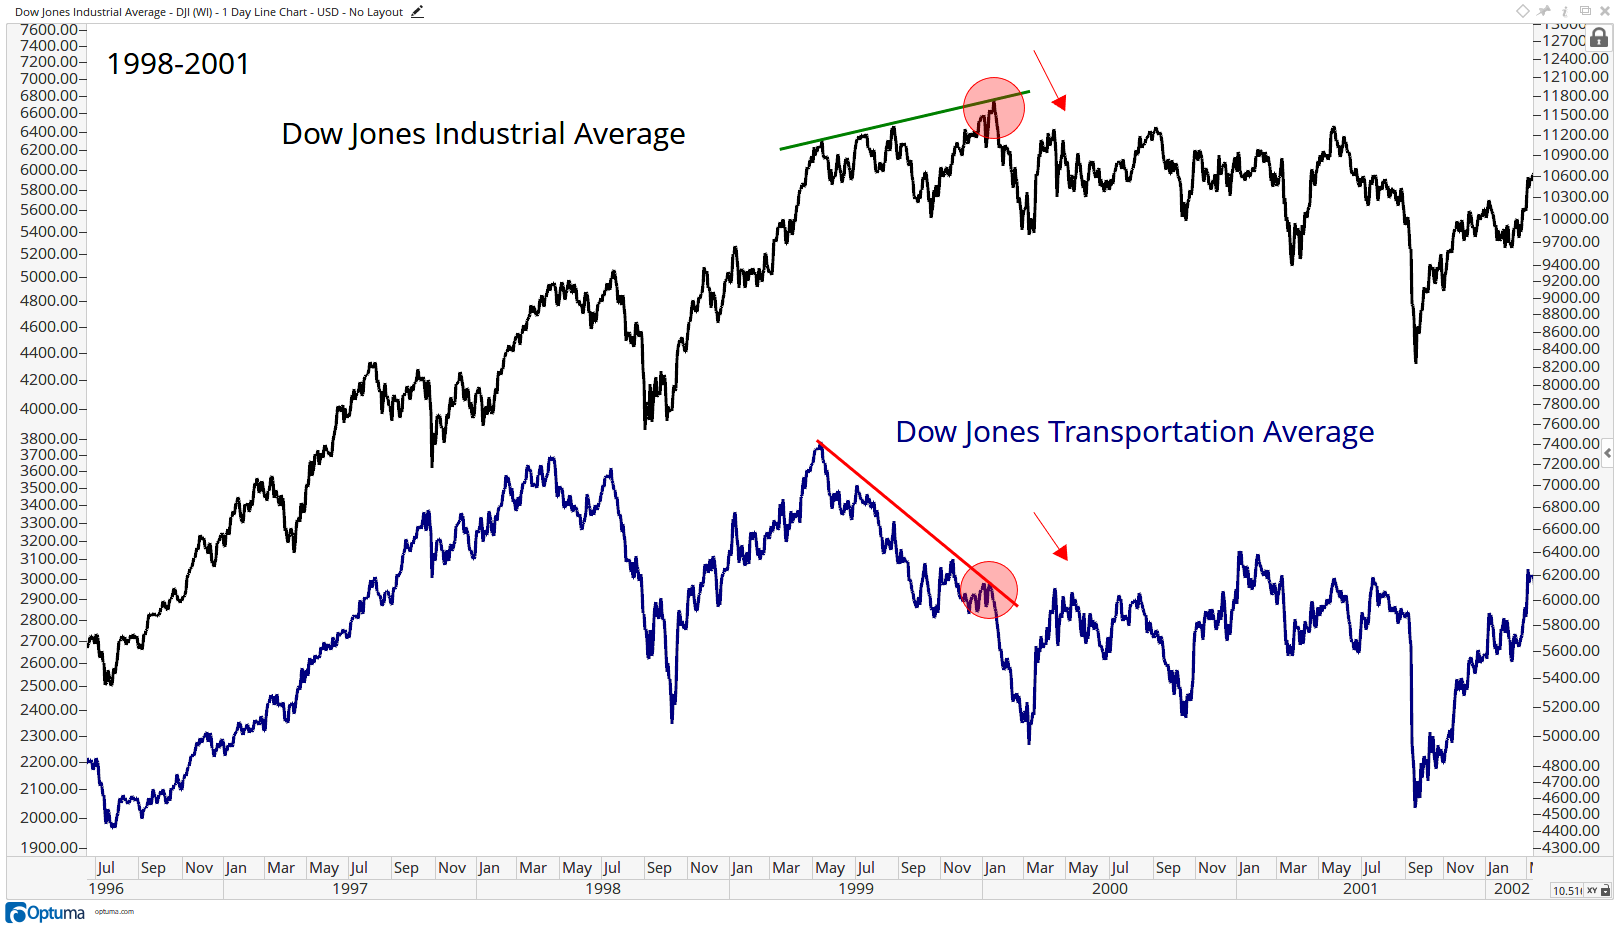
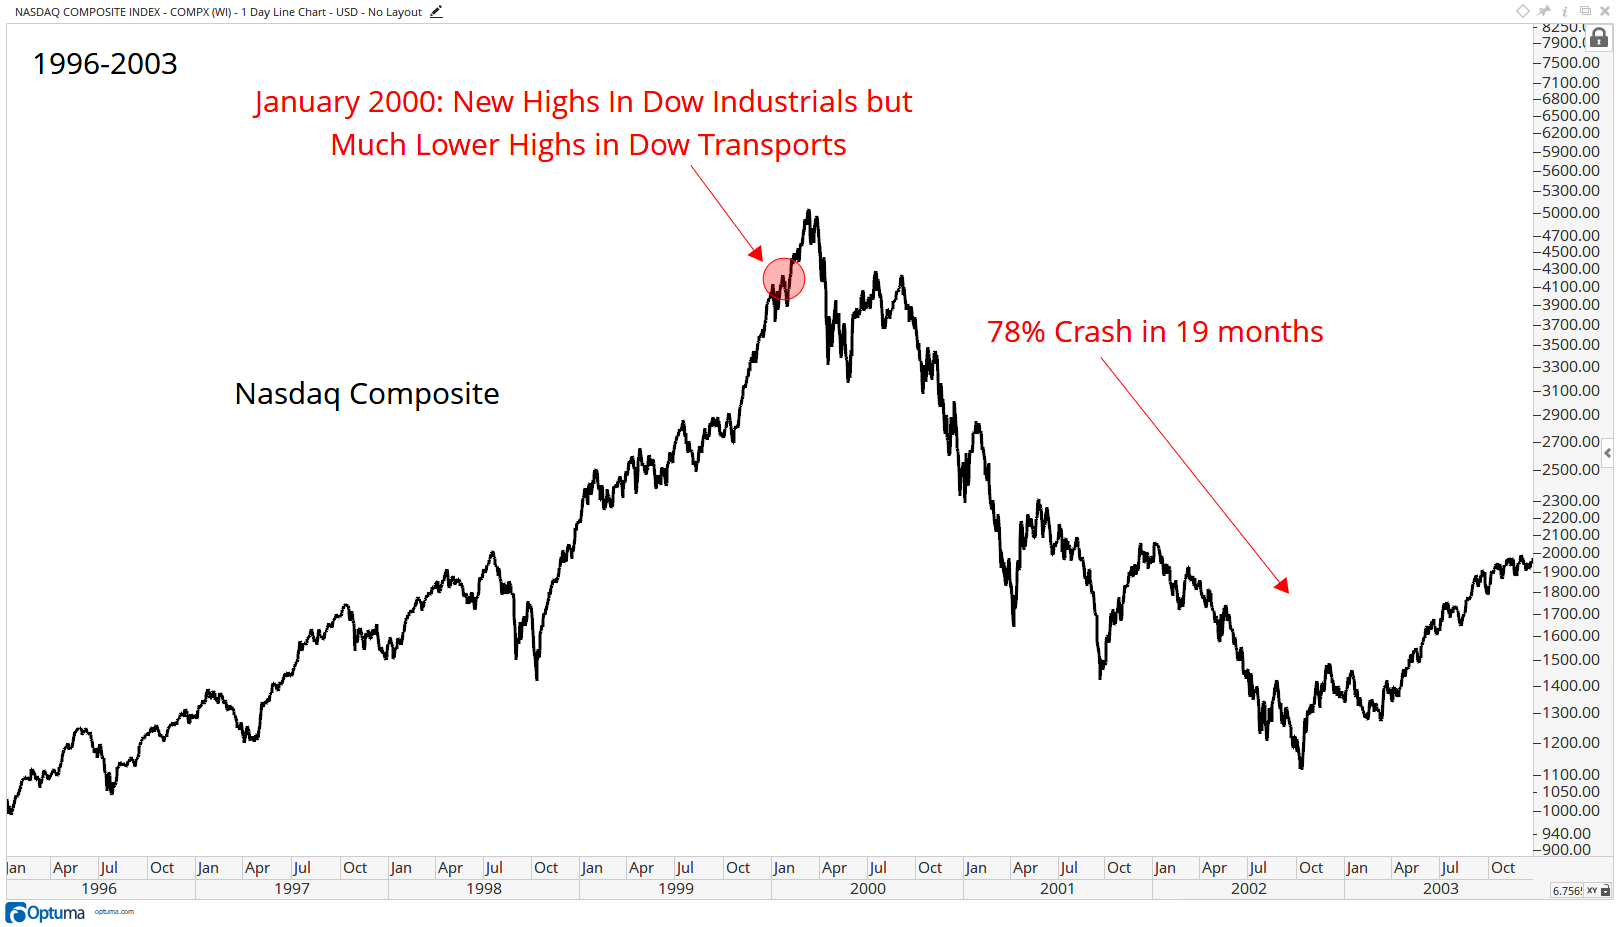
January 14, 2000, was when the Industrials made their all-time highs while the Transports were already well into a bear market. This divergence took place almost two months before the historic peak in the Nasdaq. Dow Theory was waving red flags well before any historic collapse, in this case, a 78% crash in the Nasdaq Composite.
Remember, these are not buy-and-sell signals. This is a tool to help identify the direction of the underlying trend. Also, the Dow Jones Utility Average is not part of Dow Theory and did not exist when Charlie was writing his editorials in the Wall Street Journal. But we do look at it regularly and it is included in the Dow Jones Composite Average, which we also rely heavily on.
There are many Dow Theory tenets and I have studied the work of Charles Dow for many years. Every morning I read two or three editorials from 1899-1901 written by Dow himself. It only takes me a few minutes while I make my coffee. It’s amazing how so much has changed, but supply and demand dynamics driven by our fear and greed have remained the same. It’s important to be a historian as a market participant. If we don’t learn from history, we’ll repeat those same mistakes. That’s just a fact. Plus, I’m a dork and I like all that stuff!
The next five tenets are what I consider the most useful:
Trend Identification
This is something that often gets overlooked, and I’m not sure why. Whenever we look at a stock, index, or commodity, for example, the first thing we want to do is to identify the primary trend. Are we looking at an uptrend or a downtrend, or is there no trend? This might seem overly simplistic, but it’s the first thing we need to do whenever approaching an asset.
Using multiple time frames helps to identify the trend. First, you have a longer-term Primary Trend which can be identified using weekly or monthly time frames. Then you have Secondary Trends within the larger primary trend. This can be seen using a more intermediate-term time horizon, looking out weeks and months. And finally, these secondary trends are composed of Minor Trends which last hours and days. The minor trends are where the most noise can be found and is where the financial media likes to focus most of its attention. They must believe that focusing on this short-term noise will increase their audience. In the real world, however, for those of us trying to make money in the market, which is the large majority, it is the least relevant period. The primary trends, which are the most important, are generally in place for over a year.
The Averages Discount Everything
Collectively, investors around the world dictate price action. When you take everything that is known around the world, whether fundamental, economic, whether, from the sell-side, buy-side, retail, etc, the price has discounted it all. All of the knowledge, everything foreseeable, and anything that can affect supply and demand, including human fear and greed, are built into the price. This goes for both the indexes themselves, as well as individual stocks and futures. Even unpredictable “Acts of God”, like earthquakes or other Natural disasters, even terrorist events, are quickly appraised and almost instantaneously discounted by price action.
Closing Prices Are What Matter Most
Dow Theory doesn’t care about the extreme highs and lows within a given day. Dow Theory cares even less about what happens pre-market or in after-hours trading. This is just more noise that can be seen within minor trends, as mentioned in Tenet number one above. This is noise and those who get paid to make noise pay the most attention to this stuff. It’s their job to blatantly make up reasons for why something is up or down during the prior few hours, even though they truly have no idea why.
For those of us looking to make money in the market, outside of the 0.0000000001% of the market who are day traders, recognizing that closing prices are what matter the most is extremely important. How many times have we seen early morning selloffs rally back to close positive, or early morning rallies fading to close in the red? By the time the market closes, 4:00 pm ET, in the case of US stocks, the collective marketplace around the world has agreed on a final closing price. This is, therefore, the price that we want to pay attention to the most.
On a more personal level, I see investors forget about this constantly. They are calling me or sending me emails in the morning and by 4:00 am ET the market has turned. More often though is the early week selling that turns into any of the weekly rallies. Friday’s closes are the most important. The end of the month is also really valuable information to get a longer-term perspective.
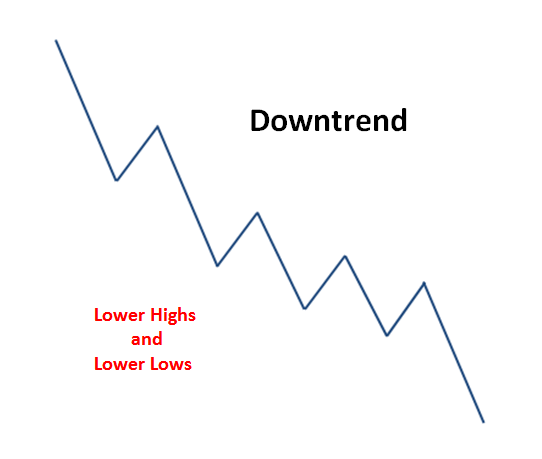
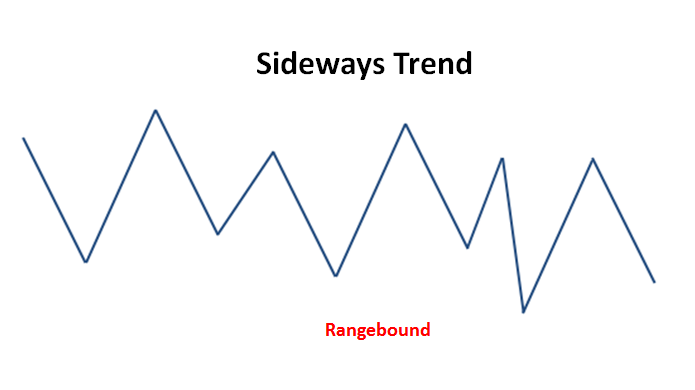
The Trend Is in Place Until It Is Not
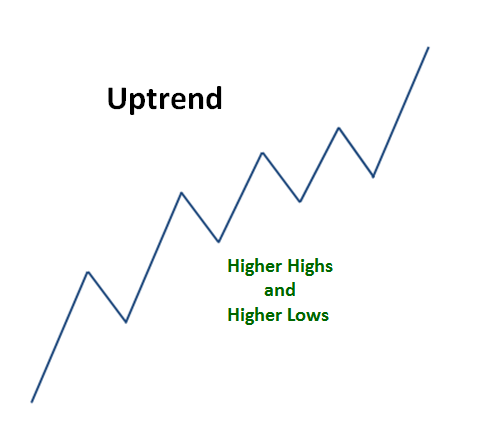
Markets trend by nature. Although we may see shorter-term fluctuations that may move countertrend, the odds always favor prices heading in the direction of the Primary Trend. This is the trend-following community’s favorite tenet, of course. There is no simple definition of a trend, other than a series of higher highs and higher lows for an uptrend, and lower lows and lower highs in a downtrend.
Throughout the evolution of the marketplace, including technological advances, we can now easily apply smoothing mechanisms, like a moving average, momentum readings, like RSI, and trend lines to help supplement price analysis to identify the underlying trend. There is a certain level of subjectivity and maturity involved with trend identification, and the methods can be unique to each investor’s personality, risk tolerance, and time horizon. The principle here to keep in mind is that the probability is always that the trend in place will continue, rather than reverse. That’s the main point we want to keep in mind from this particular Dow Theory Tenet.
There Are Bull Markets and Bear Markets
You sometimes hear people talk about “20%” as the definition of a bull and bear market. In other words, if a market falls 20% from its highs it is in “Bear Market Territory”. But if a market is 20% from its lows it is in “Bull Market Territory”. This is a blatant lie, often from media outlets that are in the business of selling ads, and not participating in markets. Let’s remember that 20% is just an arbitrary number. Imagine the lack of logic and common sense that it must take someone to willingly admit with a straight face that a 19.9% correction from highs is still considered a bull market, but a 20.0% correction means it’s a bear market. Really?
You will also hear that 10% is officially a “Correction” while a 20% decline is officially a “Bear Market”. This is another myth pumped maliciously to suit the needs of others. 10% is just as arbitrary as 20%.
Somewhere along the line, people started proclaiming “bull markets” and “bear markets” (and “corrections” too) and defining them with specific percentage moves. It is ridiculous.
If anything, with the promotional nature of financial journalism today, you see more and more headlines like, “Stocks Move into Bull Territory” or “Market Flirts With the Bear.”
Here’s a hint: It means nothing that a market is up 19% versus 21%. Don’t let the terms convince you that something has changed or that your behavior should as a result. Nobody rings a bell for a bull or bear market—and they certainly don’t become official after a specific percentage move. —Tom Brakke
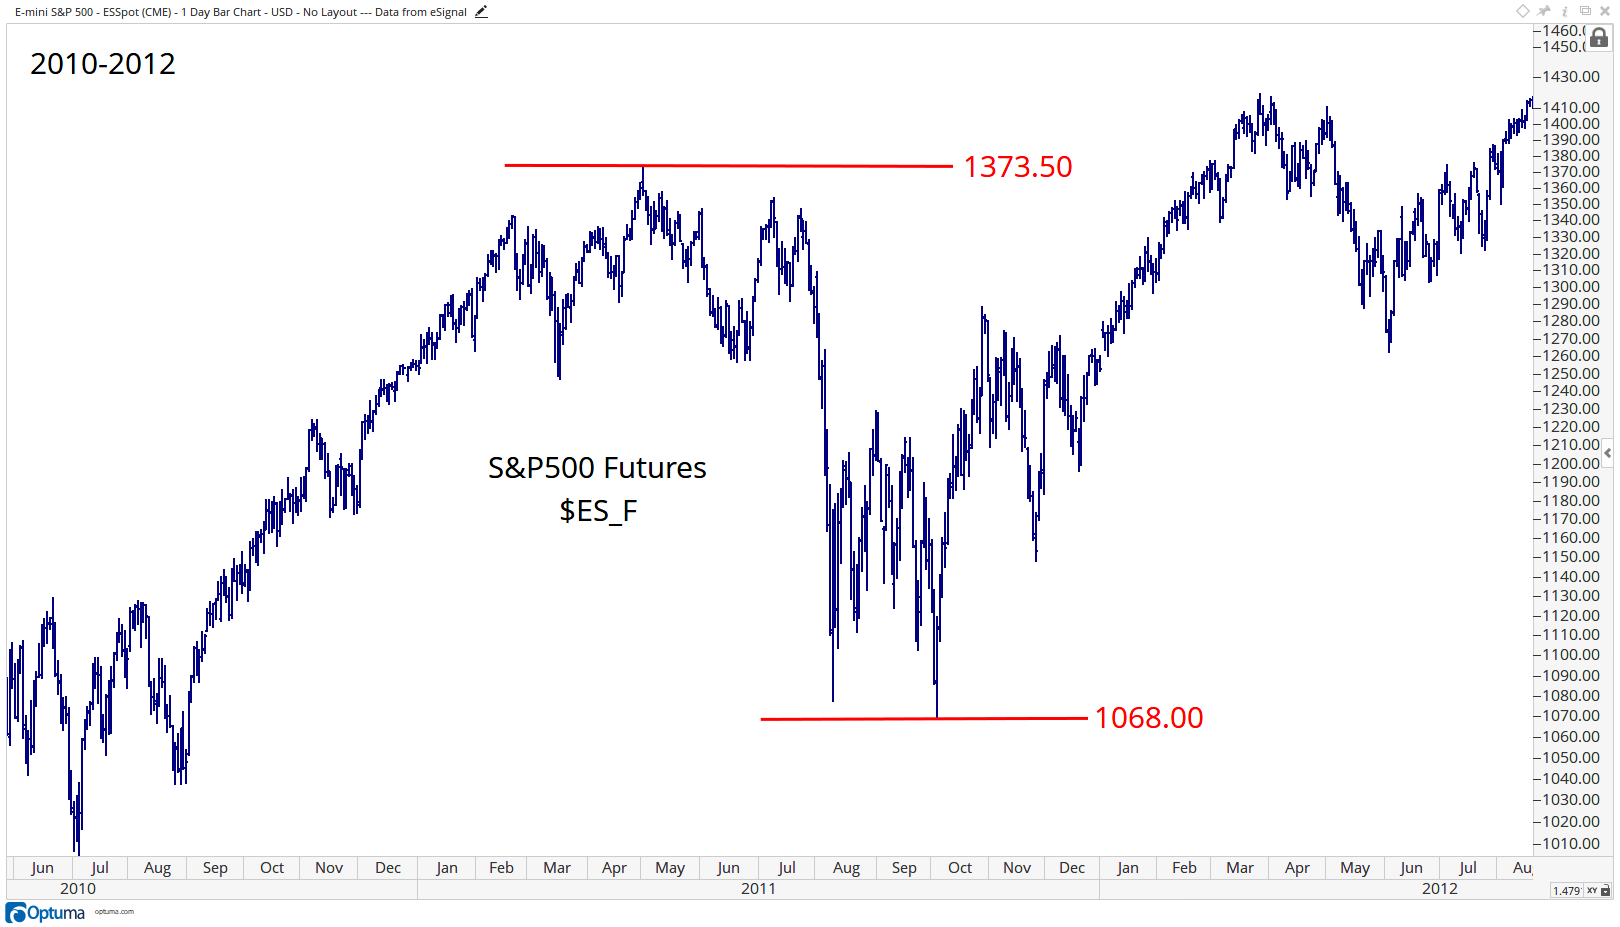
I like the 18-month rule for the major indexes. If markets are making 18-month lows, there is an element of time involved to complete a full cycle. In 2011, the S&P500 Futures fell over 22% in just five months. Was that a bear market? I don’t think that makes any sense to say it was. Where is the element of time? It was not a full cycle.
I think the 2015-2016 example is better. In this case, you have an element of time, where many stocks peaked in the fourth quarter of 2014 (Dow Jones Transportation Average included) but into early 2016, over 70% of stocks in the Russell3000 were down over 20% from their 52-week highs. This is the sort of participation that we are looking for to define a trend:
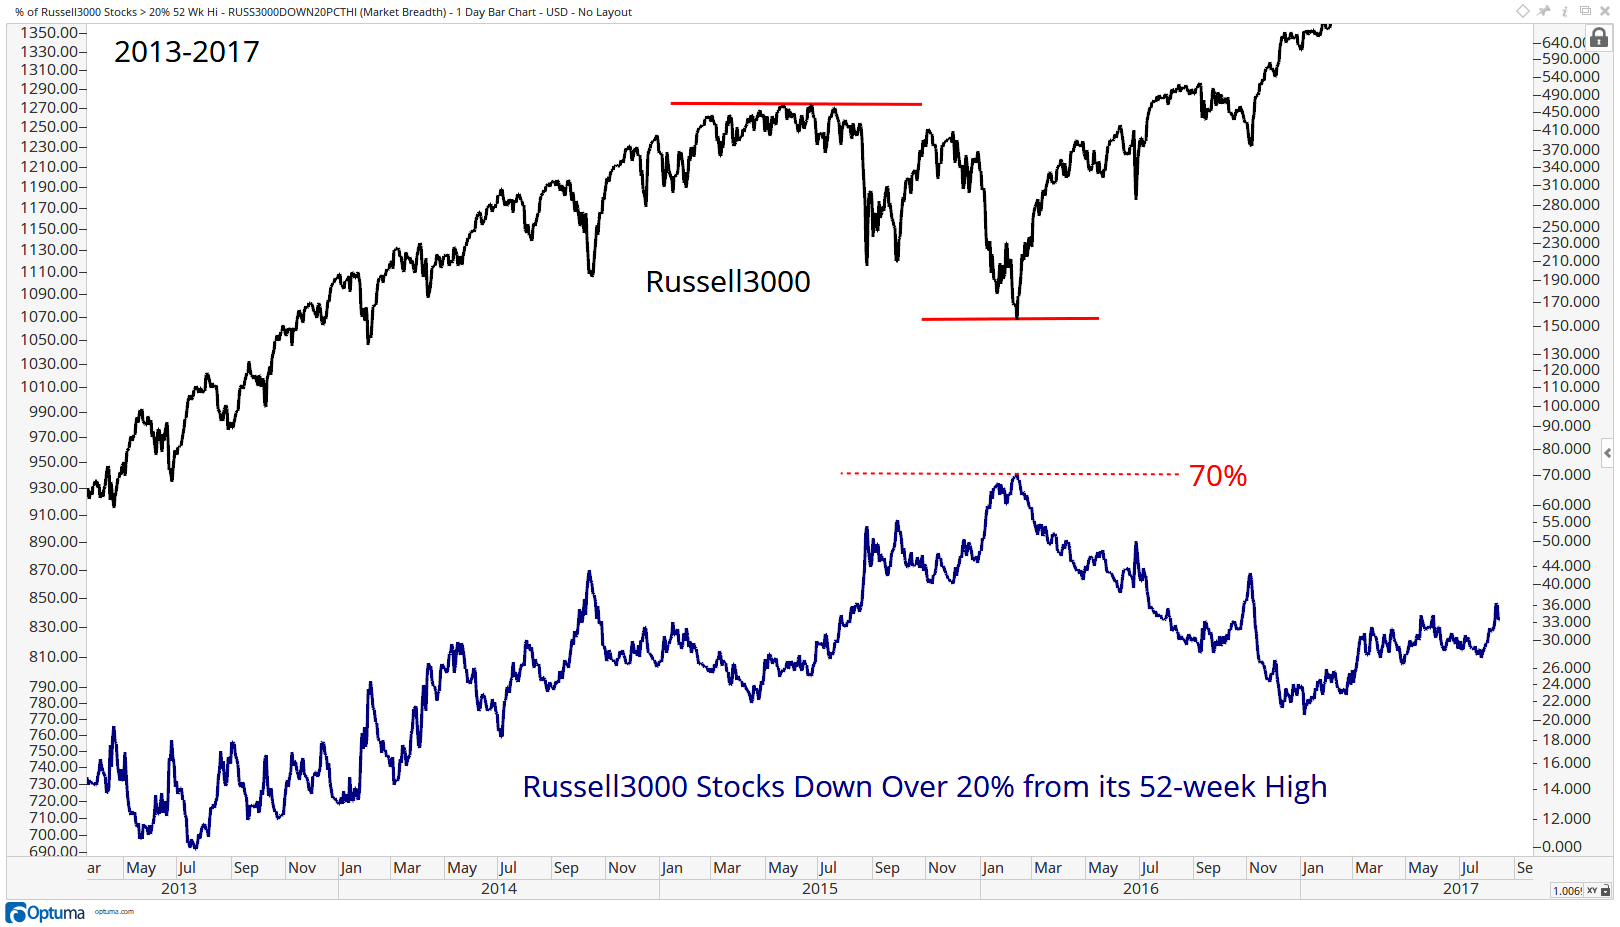
We want to take the weight of the evidence and decide whether a market is making lower lows and lower highs with expanding downside participation within the stocks in the index. This needs to take place over time, not just in a couple of months. To the upside, we want to see higher highs and higher lows with an expansion in stocks participating in the upside. We want to see an element of time as well as participation, not an arbitrary ten or 20% number. Don’t walk away when you hear people use these numbers, run away!
Here is how Charlie Dow defined these periods in the market:
Bull Markets
Primary uptrends or Bull Markets can usually (but not always) be broken down into three phases.
- Accumulation—The first is the accumulation phase, where a stock, for example, has been beaten up. The sentiment at this point is generally extremely pessimistic. The financial media rarely has anything good to say about it, and word has gotten out that the company, in the case of a stock, has been struggling.
- The Rally—The second phase is usually accompanied by a steady advance and rising trend. During this part of the cycle, technical traders looking for “breakouts” start to participate, and the skeptical media and investing public choose to categorize this behavior as “short covering”, or “dash for trash”, or whatever silly explanations they decide to come up with at the time.
- The Blow-off Top—This final stage is the most exciting time when it comes to good news and public perception. This is when the stock pops regardless of good or bad earnings, the media starts to create nicknames for the stock or a fancy new “group” that they claim it belongs to. Sell-side price targets keep getting upped regularly. Sometimes it even becomes a competition between firms to see who can set the highest target. It’s during this phase that your college buddies start to call you asking if it’s time to buy it when they really should be asking you when it’s time to sell it.
Bear Markets
Primary Downtrends, or Bear Markets, on the other hand, can also be categorized into three phases, although like in Bull Markets, not always. Remember that no bull or bear market is ever the same. The old saying goes, “It’s not that it’s different this time, it’s different every time”.
- Distribution—The first phase in a Bear Market tends to involve distribution. While the media and investing public are still all over the name, institutional money starts to fear the elevated valuations relative to prior periods and begins to sell. This is a process, kind of like a cruise ship making a 180-degree turn; it takes time and can be recognized if you’re paying attention. The media and public at this point have been trained to just assume that buying the dip will keep working as it has over the past year or few years. Rallies get sold into and breakouts fail to hold during this period.
- The Sell-off—This second phase in a Bear Market comes with a certain degree of panic. The consolidation (distribution) that took place over the past several months starts to resolve itself to the downside, as opposed to higher as consolidations did throughout the prior Bull Market. Sometimes, this panic turns into a vertical drop or even a crash. The media questions what could have possibly gone wrong and creates, even more, panic from the investing public. Evening specials about markets in turmoil start showing up (by the time it’s too late of course. Where were these specials before markets were crashing?).
- The Puke—By the time all of this has occurred, prices are well off their highs and you start to get the “throw in the towel” crowd, that just gives up on the name, or the market, altogether. News at this point is worse than ever. Public sentiment is as negative as it’s been in a long time, if not ever. But this is the atmosphere that usually comes along with the third and final phase of a Bear Market. It’s how Bull Markets are born. We want to look for evidence of Accumulation taking place. We want to see Bullish Momentum Divergences showing up. We want to see the internals improving and breadth measures bottoming. The future leaders of the next Bull Market are born during this period. The ones who don’t make that final low or two that the rest of the market seems to be making will be the leaders. That relative strength shows up early. This is the time to look for it.
Charles Dow
Charles Dow first published his Tenets in the late 1800s and they can still be applied in today’s markets. While technology has certainly changed, and markets have evolved, the one constant is human nature. Our fear, our greed, and the way we are built mentally remain the same. That’s what drives stock prices up and down: us.
The most popular tenet, which brings the most amount of noise with it, is the one that states that the Dow Jones Industrial Average must confirm the trend in the Dow Jones Transportation Average. This is important, no doubt. But it can only be applied over longer-term periods and, contrary to popular belief, it is not a buy or sell signal. I often see the lack of confirmation or confirmation being used to suggest it is time to buy or sell. It is not, and therefore not even on my list of top five Dow Theory Tenets.
Also, notice how I did not include Volume on my top five list. This was also done on purpose. This might seem like blasphemy in some circles, and I’m okay with that. But Charlie Dow’s tenet about Volume confirming price is simply not one I find very useful in today’s market. Charlie didn’t have derivatives or dark pools back in the 1800s. So with all due respect to my technical analysis predecessors who suggest volume is almost as important as price, I strongly disagree. I think times have changed and I don’t even include a volume study on my charts. I check and see if it’s liquid enough for me to participate, but volume for confirmation is not something I care for.
And that’s how I feel about Dow Theory. I hope this sheds some light on how I approach the marketplace using a 130-year-old analysis. It still works today!
To learn more about J.C. Parets, please visit Get.AllStarCharts.com.


