Inflation rate fears ruined the holiday spirit last week, with all 11 S&P SPDR sectors lower, notes Bonnie Gortler of bonniegortler.com.
Utilities (XLU) and Healthcare (XLV) fell the least, while Communication Services (XLC) and Energy (XLE) were the weakest compared to SPDR S&P 500 ETF Trust (SPY) was down -3.35%.
S&P SPDR Sector ETFs Performance Summary
12/02/22 – 12/09/22
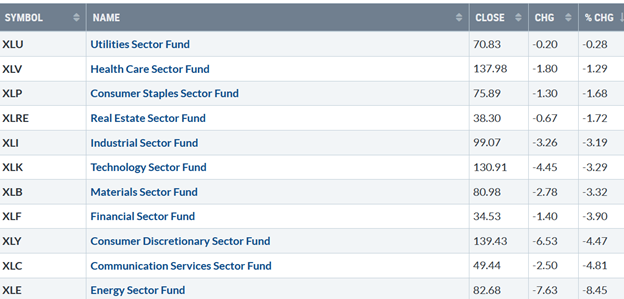
Source: Stockcharts.com
Figure 2: Bonnie's Mix of ETFs
Performance Summary 12/02/22 – 12/09/22
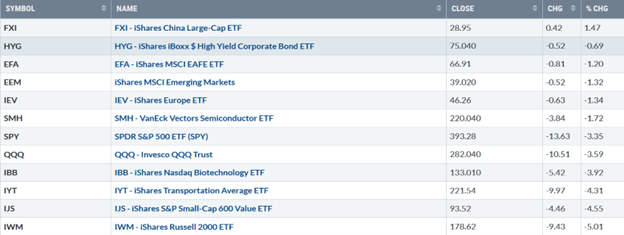
Source: Stockcharts.com
China continued higher, the strongest of the international markets. Small-Cap Value and Growth were under heavy selling pressure, weaker than the S&P 500, and not an encouraging sign in the short term.
Figure 3: Fear and Greed Index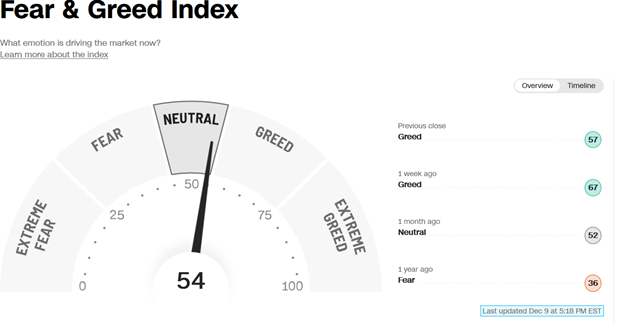
Source CNBC
Based on the CNBC Fear and Greed Index (a contrary indicator), market sentiment fell from greed to neutral, closing at 54 last week. Surprisingly the index didn’t reach extreme greed before the decline started last week.
Figure 4: UST 10YR Bond Yields Daily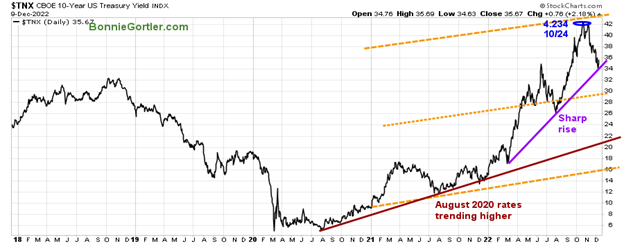
Source: Stockcharts.com
The 10-Year US Treasury yields rose, closing at 3.567%, and remaining in an uptrend (purple line), with support at 2.90%. The major averages fell on Monday last week and continued sharply lower, with the Dow falling -2.72%, S&P 500 down -3.37%, and the Nasdaq falling -3.99%. The Russell 2000 Index was even weaker, down -5.08%, and the Value Line Arithmetic Index (a mix of approximately 1700 stocks) fell -3.60%. Weekly market breadth was negative on the New York Stock Exchange Index (NYSE) and Nasdaq. The NYSE had 691 advances and 2682 declines, with 66 new highs and 208 new lows. There were 1518 advances and 3715 declines on the Nasdaq, with 122 new highs and 697 new lows.
Nasdaq breadth weakened last week, putting a damper on the rally.
Figure 5: Nasdaq Advance Decline Line Daily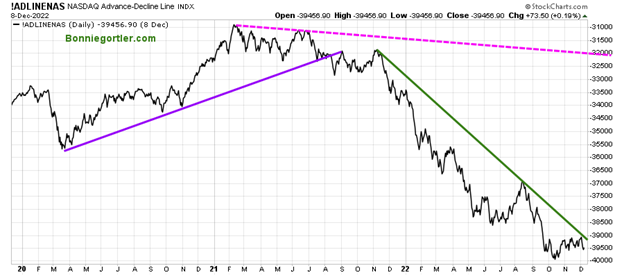
Source: Stockcharts.com
Nasdaq breadth failed to break above the 2022 downtrend, which remains in effect. Further weakness is bearish and threatens the year-end rally.
Figure 6: CBOE Volatility Index VIX
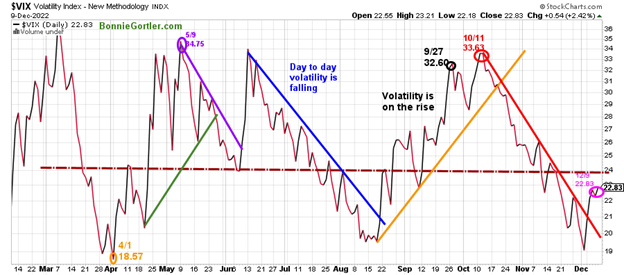
Source: Stockcharts.com
The CBOE Volatility Index (VIX), a measure of fear, has been trading above 20.00 for most of 2022. In late January, VIX peaked at 36.95 on 3/7, followed by a pullback to its low in 2022 on 4/1 at 18.57 (orange circle). VIX peaked at 33.63 on 10/11 (red circle) and has trended down following breaking the August up trend (orange line) in late October while equities rose. VIX rose last week, closing at 22.83 (pink circle), rising from its lowest level since April and breaking the downtrend (red line) that has been in effect since October 11.
Intraday volatility has remained quiet for the past few weeks but increased last week. If VIX closes above 24.00, look for more increased day-to-day volatility than we had this week.
Want a 15-minute chat with me about improving your investment process? Just email me at Bonnie@Bonniegortler.com to set it up.
Figure 7: Daily New York Stock Exchange (NYSE) New Lows
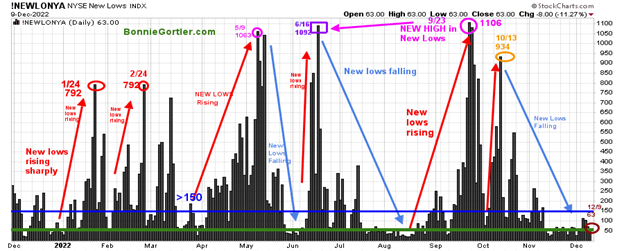
Source: Stockcharts.com
Watching new lows on the New York Stock Exchange is a simple technical tool that helps awareness of the immediate trend's direction. New lows warned of a potential sharp pullback, high volatility, and "panic selling" for most of 2022, closing above 150 in 2022. The peak reading was 9/23 when new Lows made a new high of 1106 (pink circle). New lows have contracted, trending down since October falling below 150, no longer in a high-risk area. New lows increased to 63 (brown circle), well below 150, remaining in a low-risk zone, a positive sign the decline is likely to be contained. Learn more about the significance of new lows in my book, Journey to Wealth, published on Amazon.
Small Caps weaken, which is not a sign of a healthy market
Figure 8: Daily iShares Russell 2000 (IWM) Price (Top) and 12-26-9 MACD (Bottom)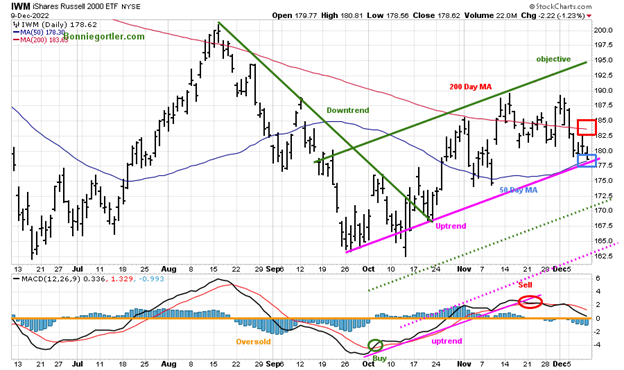
Source: Stockcharts.com
The top portion of the chart is the daily iShares Russell 2000 Index ETF (IWM), the benchmark for small-cap stocks, with a 50-day moving average (MA) (blue line) and 200-day moving average (MA) that traders watch and use to define trends. IWM fell sharply, closing at 178.62, down -5.01%, penetrating and closing below its 200-day moving average (red rectangle) last week. IWM remained slightly above its 50-day moving average (blue rectangle), holding support at 177.50 and the channel (pink line). A close below 177.50 will imply more weakness to 170.00, followed by 162.50.
MACD (middle chart) is on a sell and warned that weakness could occur when it broke its uptrend, a sign momentum was weakening. Short-term resistance is at 182.50, 190.00, followed by 195.00. A close below 177.50 would imply the short-term decline will continue, but if IWM can close above 182.50, a rally towards 190.00 is likely.
Figure 9: Daily Invesco QQQ Trust (QQQ) Price (Top) and 12-26-9 MACD (Bottom) 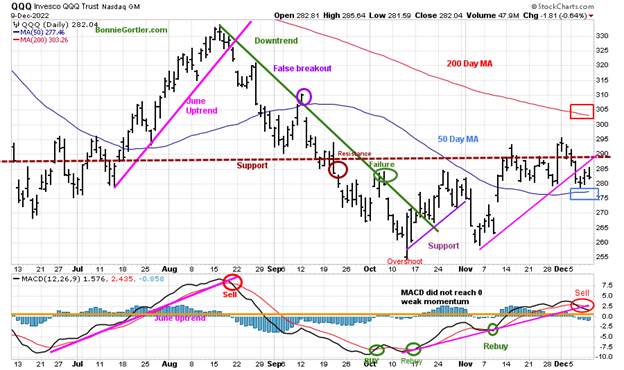
Source: Stockcharts.com
The chart shows the daily Invesco QQQ (QQQ), an exchange-traded fund based on the Nasdaq 100 Index. QQQ moved lower after a false break out (purple circle) in September of the August downtrend (green line). In November, QQQ broke its October uptrend (purple line), and the decline continued. It was encouraging that QQQ was stronger than the Dow and S&P 500 the previous week after breaking above resistance (brown dotted line), but the rally didn’t last, and QQQ fell sharply -3.59%, closing at 282.04.
QQQ support is at 280.00 and 275.00, and resistance is 290.00, 300.00, and 305.00. The bottom chart is MACD (12, 26, 9), on a sell and broke its uptrend from October.
Weakness last week despite the QQQ Intermediate Trend turning up last week
Figure 10: Weekly Invesco QQQ Trust (QQQ) Price (Top) and 12-26-9 MACD (Bottom)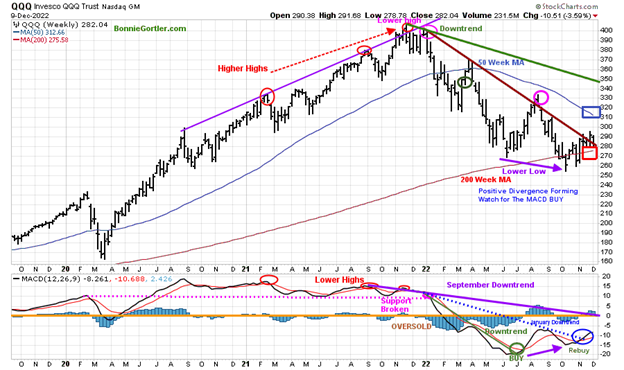
Source: Stockcharts.com
The top chart shows the weekly Invesco QQQ Trust. QQQ peaked in November 2021 (red circles) but failed to make a new high in December 2021. QQQ then formed two downtrends (brown line and green line). One downtrend (brown line) was broken back in August. QQQ immediately turned down (pink circle), making a lower low in October (purple arrow), followed by a rally in November and early December.
MACD in the lower chart made a higher low, as QQQ made a lower low, a positive divergence. MACD continues to rise after breaking the January downtrend (blue dotted line), confirming a shift in trend for the intermediate term). However, It’s disturbing that QQQ had a weekly close above 290.00 the previous week, but QQQ fell sharply. On the other hand, it would be a positive sign if MACD would break the September downtrend (purple line).
In Sum:
Momentum indicators are mixed, with MACD on a sell on the daily chart and a buy on the weekly chart. A weekly close below 275.00 support would be negative for the short and long-term increased risk of further downside before a sustainable rally.
Figure 11: VanEck Vectors Semiconductor Weekly (Top) and 12-26-9 MACD (Bottom)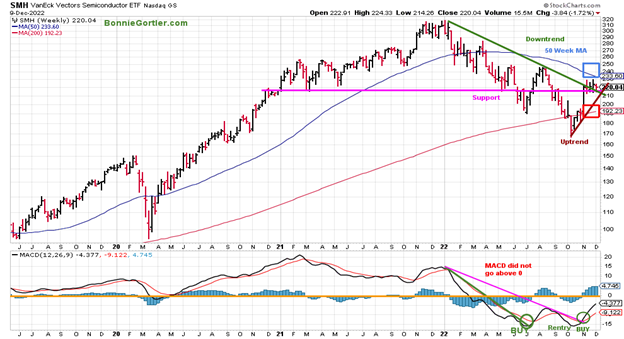
Source: Stockcharts.com
The top part chart shows the Van Eck Vectors Semiconductor (SMH) concentrated, mostly US-based ETF of mega-cap semiconductors companies. SMH is a lead indicator for the market when investors are willing to take on increased risk and the opposite when the market is falling. Semiconductors (SMH) fell less than all the major averages closing above its weekly 2022 downtrend (green line), down -1.72%, closing at 220.04, stalling below the 50-Week MA (blue rectangle). SMH shows signs of underlying strength closing above its 200-Week MA, indicating strength. Support is at 210.00 and 192.00, while resistance remains at 225.00, 235.00, and 240.00.
MACD (lower chart) remains on a buy, rising, clearly breaking the 2022 downtrend (pink line), showing positive momentum. However, MACD has remained below 0 since March, which is concerning, implying SMH may need some time to consolidate. SMH is acting well, falling less than 1% last week but failed to get above resistance at 225.00. A weekly close below 210 would imply the decline will likely accelerate towards 192.00.
Figure 12: The S&P 500 Index ($SPX) Daily (Top) and 12-26-9 MACD (Bottom)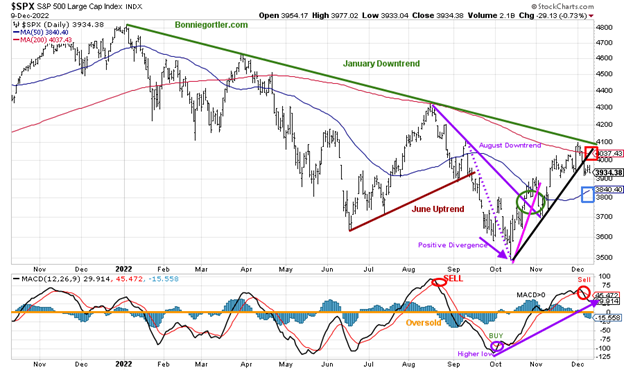
Source: Stockcharts.com
The S&P 500 (SPX) 2022 downtrend remains in effect (green line), and after holding above support on the pullback at 3700.00 in early November, SPX rallied over 400 points. Last week, the S&P 500 (SPX) failed to get through resistance at 4100.00, but it reversed lower, breaking the October uptrend (black line), falling -3.37 %, and closing at 3934.38. SPX closed above its 50-day moving average (blue rectangle), crossing back below the 200-day moving average (red rectangle) and remaining in a trading range.
Resistance remains at 4100, while support stays at 3900, 3800, and 3700. MACD, lower chart, generated a new sell last week and is not yet oversold in a position to create a buy.
Figure 13: The S&P 500 Index ($SPX) Weekly (Top) and 12-26-9 MACD (Bottom)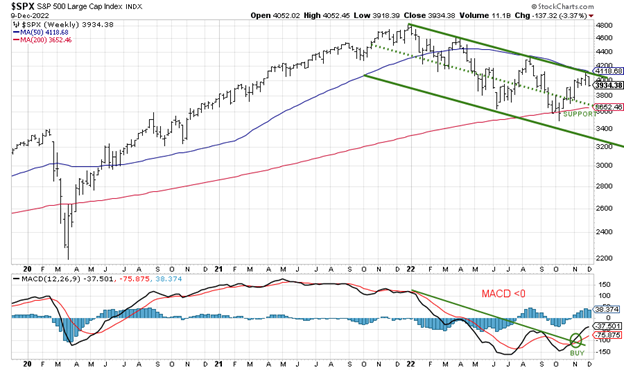
Source: Stockcharts.com
The top chart shows the weekly S&P 500 Index. SPX peaked in January 2022 and is in a downtrend. MACD remains on a buy with a favorable intermediate momentum pattern. If SPX were to decline, 3600 is a crucial support area (green dotted line) that needs to hold the middle channel (green dotted line), or expect another leg down towards the bottom channel.
Watch the direction of HYG for investor's risk appetite
Figure 14: I Shares Hi Yield Corporate Bond (HYG) (Top), and 12-26-9 MACD (Bottom)
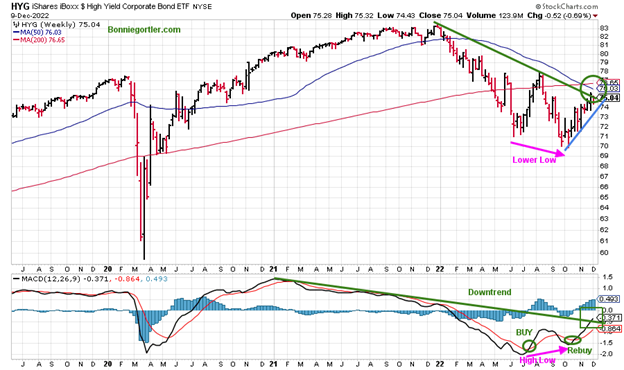
Source: Stockcharts.com
Investors have been willing to take on risk since the bottom in October, buying hi-yield bonds, which have been in a downtrend in 2022. HYG fell only -0.69% last week, a positive sign, with support remaining at 73.00 and resistance at 77.00.
MACD (lower chart) remains on a buy signal, and it continued to rise last week, breaking the downtrend (green rectangle). Strength in HYG breaking the downtrend would be bullish for equities and high-yield bonds, which are paying an attractive yield for their risk. Be alert to capital gain distributions on ETFs and mutual funds before the end of the year.
Update on Speculative BUY
Figure 15: SPDR Consumer Discretionary (XLY) (Top), and 12-26-9 MACD (Bottom)
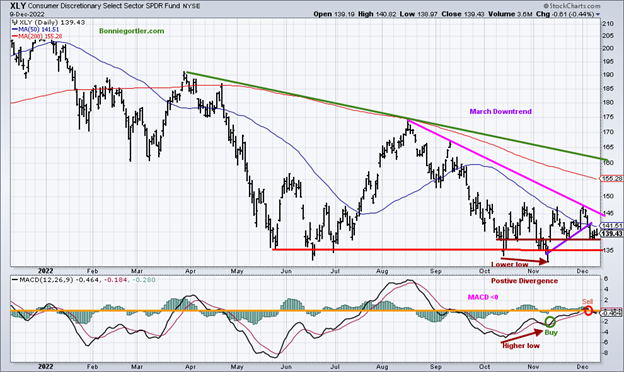
Source: Stockcharts.com
The SPDR Consumer Discretionary appeared ready to break its downtrend from August but turned down, falling -4.47%, closing at 139.4, as XLY top holdings, Amazon (AMZN) and Tesla Inc. (TSLA), almost 40% of the holdings fell -5.35% and -8.11%, respectively.
MACD gave a sell but could quickly go back on a buy. Resistance is at 142.00, and support is at 138.00. A close below 135.00 will negate my positive outlook, and all positions should be closed.
Figure 16: SPDR Energy (XLE) (Top) and 12-26-9 MACD (Bottom)
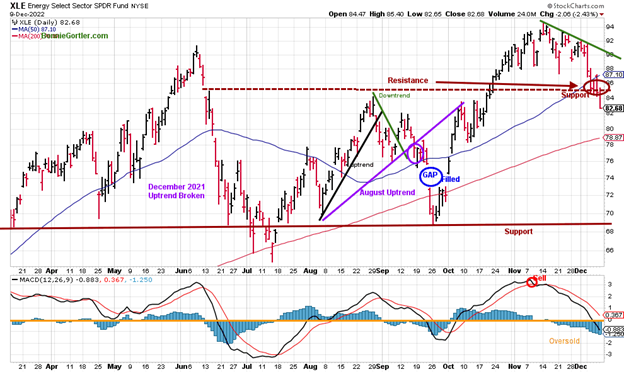
Source: Stockcharts.com
Energy (XLE), the best-performing sector of 2022, peaked in November, has lower highs, and is now in a downtrend. Last week investors took profits for the end of the year with XLE, the worst sector falling sharply, down -8.45%, closing below 86.00 support and the 50-day moving average. Resistance is at 84.00, 87.00, and 92. Support is at 81.00 and 79.00, followed by 69.00 (brown line). Caution is recommended in this sector unless XLE closes above 84.00.
Summing Up:
All major averages were lower last week as bears came out of hiding. Investors sold stocks with concerns over inflation and higher interest rates. Unexpectedly, there was no follow-through to the upside, with small-cap growth underperforming the S&P 500 and volatility increasing. The market breadth that had improved turned negative. Keep an eye on market breadth on the NYSE and Nasdaq for an expansion of new highs and contracting new lows or if market breadth remains negative and new highs decrease, and new lows increase, implying weakness ahead despite favorable seasonality. All eyes are on the Federal Reserve meeting Wednesday, December 14, to see if they raise rates by only 50 basis points or 75, which is likely to accelerate the market to the downside in the short-term. </p
>Remember to manage your risk, and your wealth will grow.
I would love to hear from you. If you have any questions or would like to talk about the market email me at Bonnie@Bonniegortler.com.
Disclaimer: Although the information is made with a sincere effort for accuracy, it is not guaranteed that the information provided is a statement of fact. Nor can we guarantee the results of following any of the recommendations made herein. Readers are encouraged to meet with their own advisors to consider the suitability of investments for their own particular situations and for determination of their own risk levels. Past performance does not guarantee any future results.