

A new year in the market beckons, and as always there is a temptation to forget the previous 12 months and focus on the opportunities which lie ahead, writes Ian Murphy of MurphyTrading.com.
This is especially the case this January because 2022 served up losses for most retail investors and hedge funds.
It’s anyone’s guess what 2023 has in store, and the uncertainty is highlighted by today’s headlines in the financial media predicting a global recession, a housing crash, a spike in diesel prices, Covid’s destruction of China’s growth, and an ever-expanding war in Ukraine.
Making predictions is an entertaining pastime, but the habit can be dangerous for people who manage their own money because we can fall into the trap of thinking that if we knew a year ago what we know now, we would have handled our trades and investments differently. This should never be the case because every year we should do the exact same thing, namely stick to our strategies because they work, while also using robust risk management (for when they don’t).
There is no doubt the year ahead will bring opportunities in individual stocks, and possibly in index-tracking ETFs also, if the right conditions occur. For the latter to happen we must reach the point of ‘capitulation’ where anyone who can’t take the pain of more losses sells up. That’s when the equity market will bottom out and the recovery will begin (more about this later).
Weekly Trend Following
Looking back at 2022, the Interactive Brokers account was dedicated to the Weekly Trend Following (WTF) strategy for the entirety of the year. This long-only strategy takes a passive approach to stocks and index-tracking ETFs but uses technical signals to enter and exit positions. The method can be applied to medium-term investments lasting a few weeks to a few months and is super simple to learn.
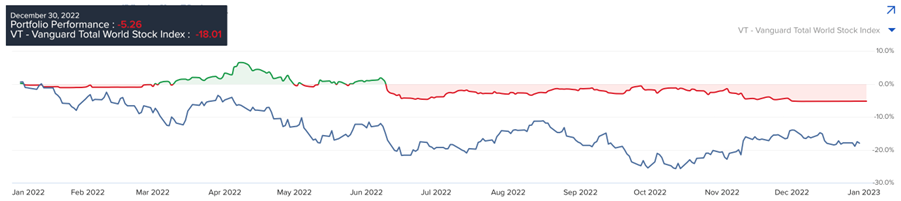
In hindsight, 2022 was not the best year to demonstrate the strategy, but it was a great year to display the power of active risk management. When benchmarked against the Vanguard Total World Stock ETF (VT) the IB account lost just 5.26%, while global stock markets were down 18.01%. In the US, the S&P 500 (SPX) fared even worse by shedding 20.3%, and the tech-heavy NASDAQ index saw a whopping decline of 33%. In addition, some high-profile money managers were left with eggs on their faces including the super-confident Cathie Wood who oversaw an eye-watering decline of 67% in her firm’s flagship ARK Innovation ETF (ARKK).
After a flat first quarter on the IB account, Q2 produced some reasonable gains before the market took a dip in June and I was required to sit in cash as per my risk management rules. As it turns out this was the best way to preserve capital because even bonds had a miserable year.
The account is priced in Euros, but I switched the cash to US dollars during the year due to the relative strength of the greenback. This explains the slight fluctuations during the fall, and the flatlining at the end of the year when the thinking of various central banks became clearer.
Daily Swing Trading
While the IB account spent half the year in hibernation, the TradeStation side of the house was busy with regular daily swing trades when the opportunity arose. In a bear market such as we had in 2022, the idea is to grab profits quickly by scaling out of a move and then closing the position at the first sign of trouble.
Swing trading is usually a mundane process where we get entry signals from a semi-automated screener (available in the Store) and then we follow the rules and plug away at the strategy. It’s a numbers game, where we can expect about half the trades to breakeven or incur a small loss, but the winning trades make up the difference and the strategy is profitable over time.
When an unusual trade arises, or one is challenging to manage, I send a note to Subscription Clients (also available in the Store) because it’s a great opportunity to learn trade management techniques with a real-life example. Global Payments Inc. (GPN) was a case in point.

The original entry was at the red arrow, but frustratingly the trade was stopped out the day after on some whipsaw price action. Thankfully it set up again the following day (blue arrow) and the first target based on the second entry has already been hit. The initial protective stop and three targets for the second entry are shown above with dashed lines (click the chart to enlarge). The trade is still active, and it will be interesting to see how it performs this week, keep an eye on it.
Finding the Market Bottom
US stocks spent 2022 in a bearish trend and investors are nursing painful losses, meanwhile, the real economy is flirting with a recession as the Fed continues to hike interest rates. Ideal conditions are now in place for a bottom to form in stocks and a recovery to begin in 2023 - but how will we know when the bottom is in?
On Wednesday, January 18, at 11:20 ET I will be presenting ‘The Stock Market Bottom Is Coming, Are You Ready?’ at the MoneyShow® Virtual Expo. In this compact presentation, I will share my favorite technical tools which nailed market bottoms in the past and will no doubt identify the best time to buy in the year ahead. With the aid of personal charts, I will demonstrate the patterns to look for and how to monetize the coming trend change. The presentation will be followed by a Q&A session. Click the image above now to reserve your FREE place.
Drop me an email if you have any queries. Stay safe and trade safe in 2023.


