

The stock market began 2023 with positive indications of improvement; however, it's important not to be misled, states Deron Wagner, Founder and Head Trader at Morpheus Trading Group (MTG).
The S&P 500 and Nasdaq are currently at pivotal, long-term resistance levels. 2023 is off to a positive start for the stock market, but will the short-term upward trend continue? The S&P 500 and Nasdaq 100 are currently facing major obstacles at their long-term downtrend lines and 200-day moving averages. To make smart investment decisions and stay ahead of the market, understanding these key technical levels is essential.
In this article, we dive into the index ETF charts of the S&P 500 ETF (SPY) and Nasdaq 100 ETF (QQQ). We also show you recent relative strength in S&P Midcap 400 ETF (MDY). Let’s dive in.
The Stock Market Trend Heading Into 2023
Throughout 2022, major indices were on a downward trend, forming year-long downtrend lines from their all-time highs in Dec 2021/Jan 2022. Additionally, the market's weakness caused the main stock market indexes to fall below their 200-day moving averages, a significant indicator of a long-term trend. As 2023 began, the S&P 500, Nasdaq, and other broad market indices were below their downtrend lines and 200-day moving average, but where do they stand now? Let's take a closer look.
Spy: S&P 500 ETF Meets Resistance at Long-Term Downtrend Line
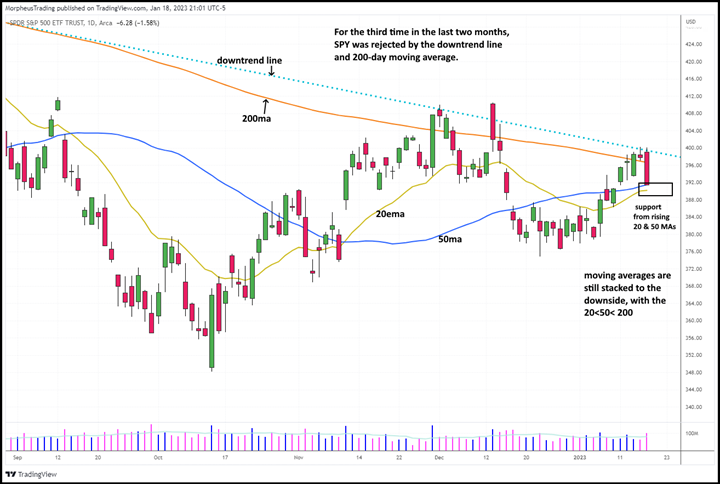
After recovering from its two-year low in October 2022, $SPY attempted to break above its long-term downtrend line two months later. However, the downtrend line and 200-day moving average acted as barriers and resulted in the price reversing lower after two attempts. This week, $SPY once again tried and was unable to regain its 200-day moving average and downtrend line—the third unsuccessful attempt in less than two months. See the annotated daily chart of $SPY below:
On January 18, $SPY experienced a 1.5% drop and is now at the support of its rising 50-day moving average (MA), which is closely followed by the 20-day exponential moving average (EMA). If t holds, this convergence of short-term support could potentially lead to the S&P 500 to another breakout attempt in the near future. If current support from the 20 and 50-day moving averages fails to hold, we will look for $SPY to possibly find support with a "higher swing low" (above the $375 area).
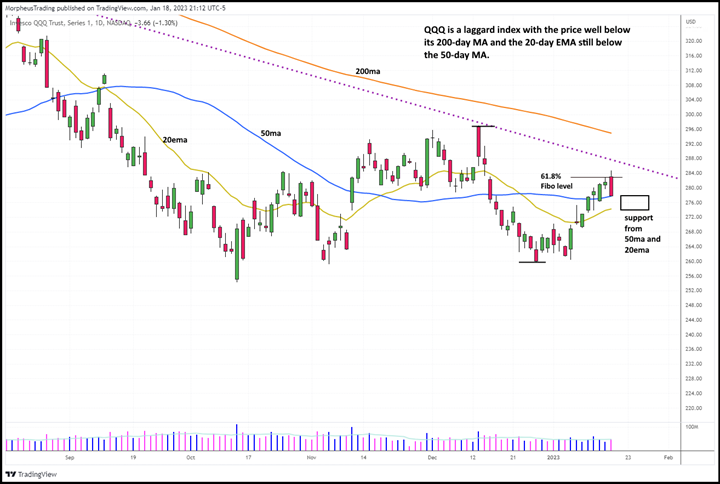
However, if it breaks below December 2022 low, it would be cause for concern, as it would invalidate the current three-month recovery attempt. As for $QQQ (Nasdaq 100 ETF), it continues to underperform, not having reached its 200-day MA since March 2022. It also remained below its downtrend line throughout:
While $SPY has already attempted to break above its 200-day moving average and downtrend line this week, $QQQ is displaying relative weakness by trading significantly below both major resistance levels. The January 18 sell-off caused $QQQ to land at the crucial, intermediate-term support of its 50-day moving average. Although the 20-day exponential moving average (EMA) is just below, that red candle could potentially form a lower high (below the Dec. 2022 swing high).
If $QQQ fails to hold above its 20-day EMA, it could swiftly test its December swing low. If that level also fails to hold, $QQQ would form a lower high and lower low, signaling a possible continuation of the dominant downtrend.
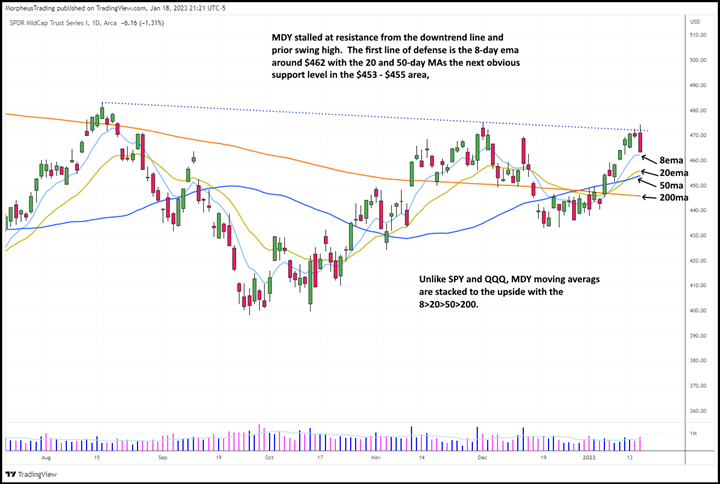
Despite both $SPY and $QQQ trading below their downtrend lines and 200-day moving averages, $MDY has been displaying stealth relative strength by outperforming both since October 2022. It's the only major index ETF currently trading above its 200-day moving average, and with all moving averages trending upwards (8 EMA > 20 EMA > 50 MA > 200 MA):
Although $MDY is currently above its 200-day moving average, it is still below its downtrend line. Similar to $SPY, $MDY faced strong resistance after coming into contact with its downtrend line on January 18. This price action, coupled with moderate relative strength, could result in sideways to downward movement in the upcoming week. Be prepared for potentially choppy and uncertain price action.
The ideal scenario would be for the price to pull back slightly, and then fluctuate while remaining above its rising 20 and 50-day moving averages. However, a breakdown below the 200-day moving average and prior swing low would indicate a bearish trend. When it comes to trading, keep in mind that institutional investors are also monitoring these key trendlines and indicators, so be prepared for potential volatility and uncertainty in the short term.
In addition to trendlines and moving averages, pay attention to how leading stocks and sectors react to weakness in the coming days, as this will provide insight into the strength of the bull or bear case. For now, our swing trade portfolio remains primarily in cash, allowing us to be flexible and ready to respond to any market developments. Remember to always trade what you see, not what you think!


