

The Americas are on holiday today. Stock markets in the US will remain closed this morning for Presidents’ Day, while north of the border Canadians celebrate Family Day, and down south Brazilians will be dancing in the street for Carnival, writes Ian Murphy of MurphyTrading.com.
Unfortunately, no one was dancing on Wall Street last Friday because the Pessimism Indicator closed above 10% again while the S&P 500 (SPX) closed on the EMA. This is something we have not seen for almost a month. For US equities the Pessimism Indicator is like a canary in a coal mine, it’s an early warning sign that something may be amiss under the surface.
As I’ve stated many times before, an examination of stocks that are making new high prices and new low prices is the best leading market indicator available to retail traders. The Pessimism Indicator (red line below) counts the number of US stocks making (or repeating) a new low price for the past 20 trading days.
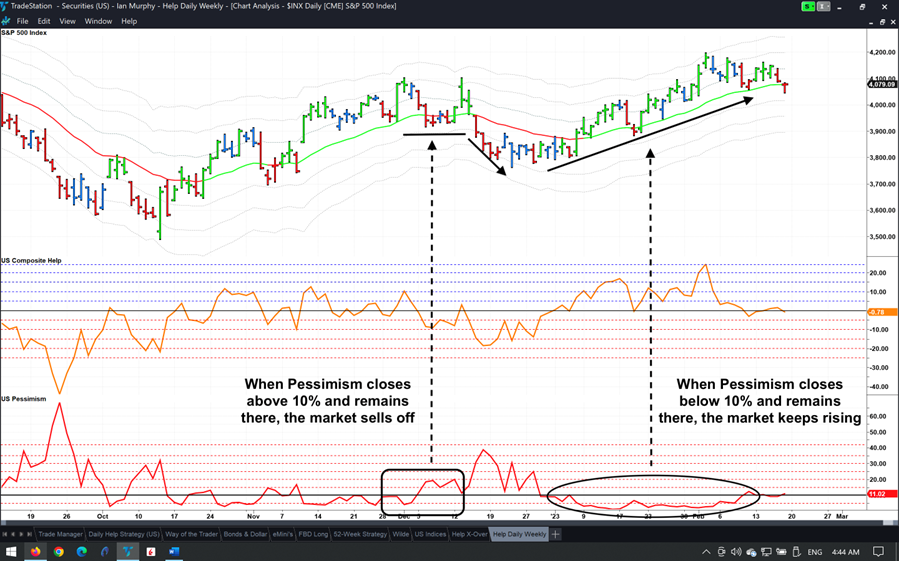
As we have seen throughout January and earlier this month, when Pessimism drops below 10% and stays there, the markets are more likely to keep rising (oval). However, when Pessimism crosses above 10% and stays elevated the likelihood of a selloff increase (rectangle). The key thing to look for is a crossover of the 10% line—notice how it flagged the selloff last December about a week before it happened.
So how does this apply to the current situation? If Pessimism stays above 10% this week a more pronounced selloff in stocks is likely to occur. If it falls back and remains below 10%, the bull run will continue.
Learn more about Ian Murphy at MurphyTrading.com.


