

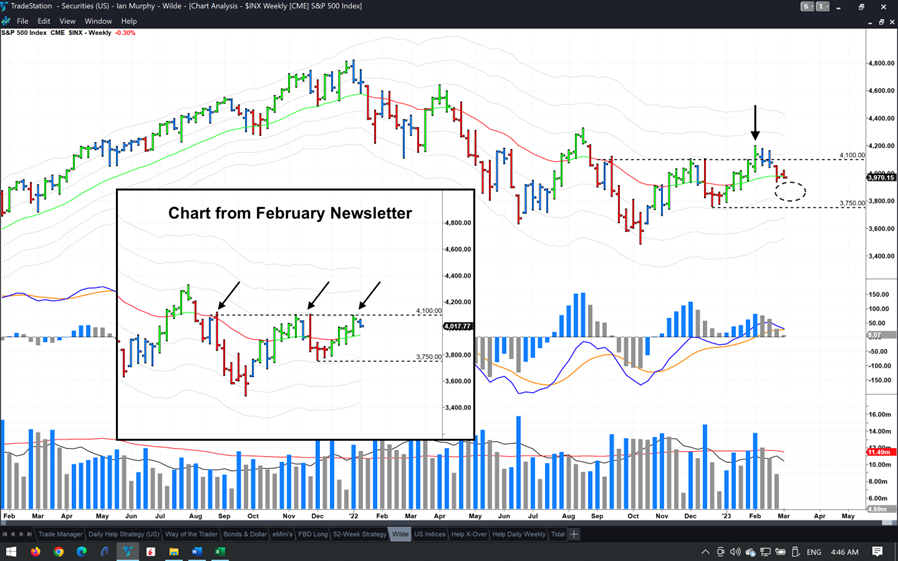
February’s newsletter laid out the current resistance and support levels for the S&P 500 (SPX), states Ian Murphy of MurphyTrading.com.
These levels always form above and below the price like a ceiling and floor, but the current levels have huge importance as a breakout, either way, will likely define the market direction for 2023. The newsletter stated, ‘If the S&P can break above this resistance [4100] and hold above it then a bull market is on, if not, another selloff in stocks is the more likely outcome.’
Click charts to enlarge
Fast forward a month and that overhead ceiling (which coincided with the -1ATR line) has proven to be too strong for buyers to breach. After the screenshot was taken (insert chart and arrow) the week’s price bar rallied and closed above the 4100 level, so things looked promising, but buyers took flight the following week and the price sold off from then on.
Focus now switches to support from below. We already have a first higher low pattern at the -1ATR line (3750) and another higher low will need to form just below where we are trading now (dashed circle) if the bullish trend is to continue. If not, then the message from last month still holds true, a selloff in stocks is the more likely outcome.
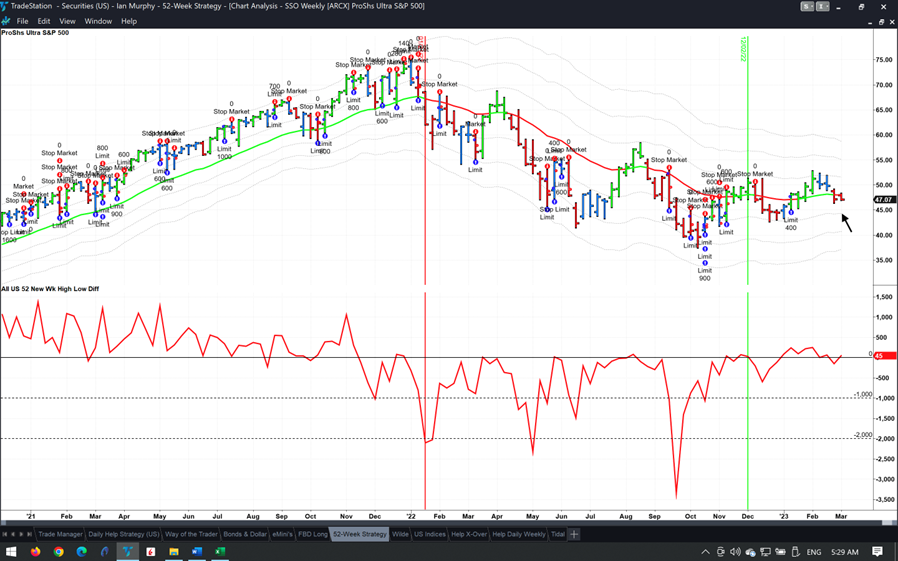
Unlike many market commentators, I practice what I preach, and I have ‘skin in the game’ based on the analysis shared above. In case the bulls win this tussle, I bought 400 shares in SSO at $47.70 on January 12 as seen with the last blue arrow on the right (the other trades on the chart were demonstrating the Help Strategy). This position is being managed with the 52-Week Strategy which is a pure play on the US equity market using a weekly trend-following approach. The trailing stop is currently at $44.34 on a weekly closing basis (black arrow).
Theory and Practice
Last week marked the anniversary of Russia’s invasion of Ukraine, and I was asked numerous times throughout the year about defense stocks. As listed firms replenish hardware spent on the battlefield, buying stocks in the sector might appear to be a sure thing, but the reality is more complicated, and many firms have not performed as one might expect.
Admittedly the overall stock market had a poor 2022 and defense stocks outperformed in general but managing individual trades was not all plain sailing. For example, the three leading US defense firms, Northrop Grumman (NOC), Lockheed Martin (LMT), and General Dynamics (GD) are all currently trading below the peak reached immediately after the invasion (dashed lines below).

NOC (left above) had the cleanest run-up in price in 2022 but a 17% plunge in January wiped out more than half the 2022 rise. LMT never really gained traction or established a trend and has ended up back where it was this time last year. As for GD, after the initial pop it settled into a trading range and has languished there ever since. Interestingly, the stock gained 43% in the year prior to the invasion, possibly a case of ‘buy the rumor and sell the news’?
Source: Yahoo Finance
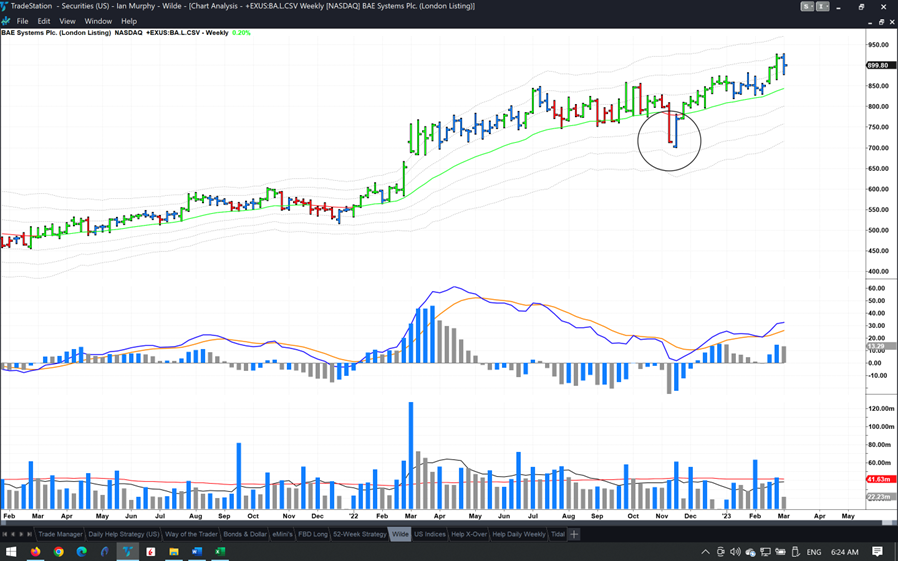
UK-based BAE Systems Plc. (BA.L) jumped after the invasion in February 2022 and has chalked up a 50% gain since then. Unfortunately, even BA was not a trouble-free journey as a painful whipsaw last November would have triggered trailing stops on a weekly chart (circle). Even the most accommodating stop at the -1ATR line on a closing basis would have been activated. At that point, a decision needed to be made to re-enter or stay on the sidelines.

Source: Yahoo Finance
Closer to the frontline, Rheinmetall AG (RHM.DE) in Germany has seen its share price increase 167% since the week before the invasion began. But the price closed below the -1ATR line three times last fall meaning a trader or active investor would have been triggered out. Here again, a decision needed to be made to re-enter or not.
Both of these stocks raise an important question about using a protective stop on long-term trend-following positions. Why use a stop at all? Would it not be better to stay in for the duration? In these two cases that might have worked, but what about the three US stocks above? And what if BA and RHM start falling this year? At what point do you sell?
Regardless of whether we are using technical tools to manage positions or investing in stocks using fundamental analysis, we must have a rule on when to get out. This is especially the case when using our own money. From my perspective, it’s better to grab some of a trend and bank the profits rather than hang on to a falling stock and destroy your account. You will always have more opportunities; you won’t always have more cash.
Learn more about Ian Murphy at MurphyTrading.com.


