

Day-to-day volatility continued, with nine of the eleven S&P SPDR sectors positive last week, notes Bonnie Gortler of bonniegortler.com.
Communication Services (XLC) and Energy were the leading sectors, while Utilities (XLU) and Real Estate (XLRE) were the weakest, with the SPDR S&P 500 ETF Trust (SPY) up +1.48%.
S&P SPDR Sector ETFs Performance Summary 3/17/23-03/24/23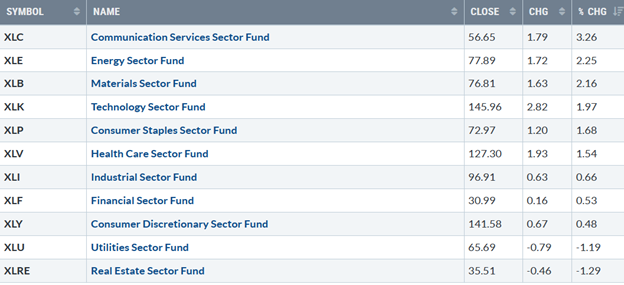
Source: Stockcharts.com
Figure 2: Bonnie's ETFs Watch List Performance 3/17/23-03/24/23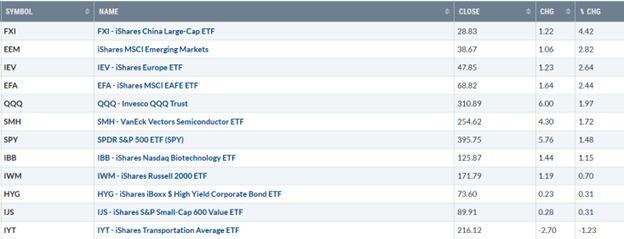
Source: Stockcharts.com
International markets rose last week as the US Dollar weakened. Investors continued to favor Mega Cap Technology and Semiconductors while Transports lagged and were out of favor.
Figure 3: CBOE Volatility Index VIX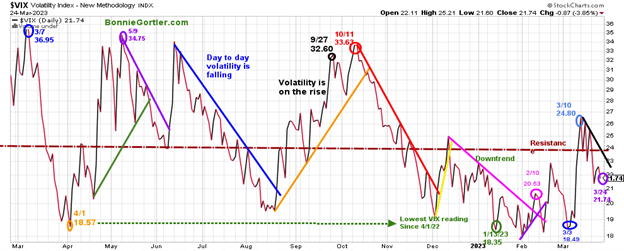
Source: Stockcharts.com
The CBOE Volatility Index (VIX), a measure of fear, traded above 20.00 for most of 2022, with a high at 36.95 on 3/7 (blue circle) and a low on 4/1/22 at 18.57. A new VIX low didn’t occur until 1/13/23 at 18.35 (green circle).
VIX fell sharply last week, closing at 21.74 (purple circle), closing above 20.00, suggesting daily intraday swings will remain high. If VIX breaks the downtrend (black line) and closes above 24.00, day-to-day volatility will increase and go above the high made in March and potentially test the October 22 highs.
Figure 4: UST 10YR Bond Yields Daily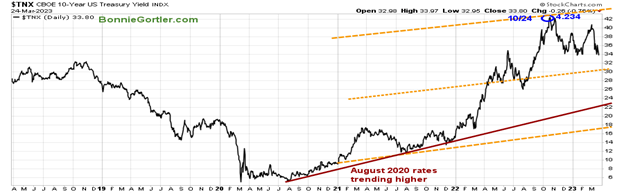
Source: Stockcharts.com
The ten-year US Treasury yields declined last week, closing at 3.338, as investors continue buying treasury bonds for safety. Support is 3.00%, and resistance remains between 4.25% and 4.40%. The major averages were resilient despite the uncertainty about the banking system's stability. The Dow gained +1.18%, the S&P 500 was up +1.39%, and the Nasdaq gained +1.66%. The Russell 2000 Index showed a gain of +0.52% after falling sharply over the past few weeks.
Figure 5: Value Line Arithmetic Average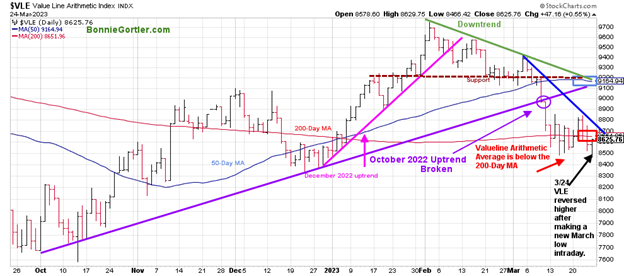
Source: Stockcharts.com
The Value Line Arithmetic Index (a mix of approximately 1700 stocks) remained in a downtrend after breaking the October uptrend (purple circle) in early March. VLE remains below the 50-Day MA and under the 200-Day MA. However, it’s positive VLE closed at its high after falling below its March low on Friday intraday to finish the week higher by +0.82% last week.
Confirmation of further strength would be if VLE closes above the 200-Day MA (8551.96 as of 03/24/23), and breaking the March downtrend (blue line) would imply the worst part of the decline is over and the start of a short-term rally. Resistance lies at 8700, 9000, and 9200.
The risk of further decline in the broad market remains as long as the Valueline Index is in a downtrend. Learn about coaching with Bonnie. Ask questions. Discover more about the coaching processes in this 15-minute call by emailing me at Bonnie@BonnieGortler.com. I would love to schedule a call and connect with you.
Weekly market breadth was positive on the New York Stock Exchange Index (NYSE) and for Nasdaq but not impressive. The NYSE had 1808 advances and 1385 declines, with 83 new highs and 401 new lows. There were 2728 advances and 2294 declines on the Nasdaq, with 186 new highs and 730 new lows.
Market internals remain concerning
Figure 6: Nasdaq Advance Decline Line Daily 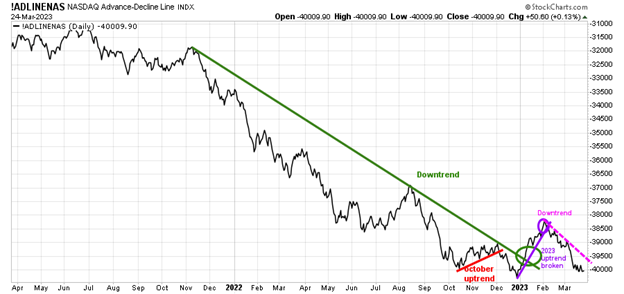
Source: Stockcharts.com
The chart is the Nasdaq Daily Advance-Decline Line, a technical indicator that plots the difference between the number of advancing and declining stocks. In January, the October 2022 downtrend was broken (green line) but was short-lived, followed by the short-term uptrend (purple line), giving way as market breadth deteriorated in February 2023. There was not much change from last week to this week, with the downtrend remaining in effect (pink line) despite the strength in the Nasdaq. Watch the market breadth if there is an expansion of net advances than declines, more new highs, and fewer new lows, or if there are more declines than advances and an increase in new lows and fewer new highs, which would be negative.
Figure 7: Nasdaq New Highs 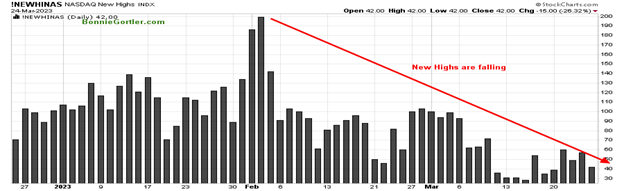
Source: Stockcharts.com
The Nasdaq Index rose +1.66% and is up 12.97% in 2023. However, it concerns me that the number of stocks making new highs has been falling since February and are not expanding. If there is no expansion in New Highs, and money managers and institutions stop buying Large Cap Tech as end-of-the-quarter window dressing pauses, a pullback in Nasdaq is likely.
New Lows are no longer falling on the Nasdaq but have started to rise
Figure 8: Nasdaq New Lows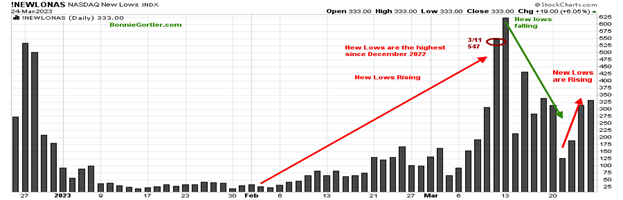
Source: Stockcharts.com
Nasdaq's new lows are no longer falling on the Nasdaq but have started to rise despite the gains in the Nasdaq. Nasdaq's new lows are higher than in early 2023, which is worrisome if this trend continues.
Figure 9: Daily New York Stock Exchange (NYSE) New Lows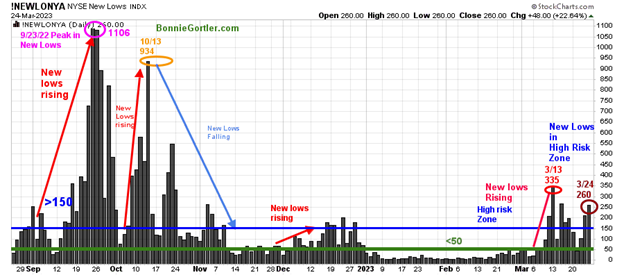
Source: Stockcharts.com
Watching new lows on the New York Stock Exchange is a simple technical tool that helps awareness of the immediate trend's direction. New lows warned of a potential sharp pullback, high volatility, and "panic selling" for most of 2022, closing above 150. The peak reading was 9/23/22 when new lows made a new high of 1106 (pink circle), and new lows expanded to their highest level in 2023 on 3/13 (red circle) to 335, well under the peak for now.
Last week despite the market higher, new lows rose close last week to 260 on 3/24 (brown circle), remaining in the high-risk zone, above 150 (blue horizontal line), implying increased risk.
Here is an excerpt when new lows are above 150, the market is negative, higher risk, and selling is taking place. Sometimes it could be severe, and sometimes on a very nasty day, you can have “panic selling,” and big wild swings (high volatility) to the downside may occur. Learn more about the significance of new lows in my book, Journey to Wealth, published on Amazon. Caution is recommended until new lows fall below 150 and contracts below 50.
Small Caps downtrend continues
Figure 10: Daily iShares Russell 2000 (IWM) Price (Top) and 12-26-9 MACD (Middle) and Money Flow (Bottom)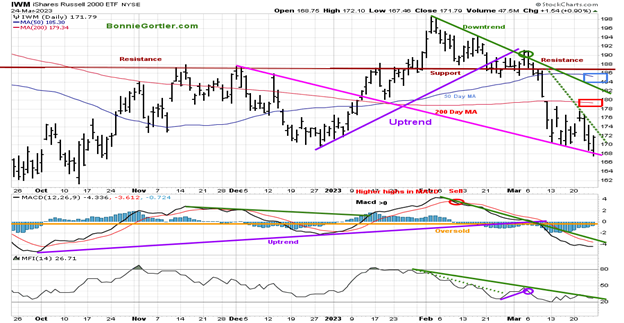
Source: Stockcharts.com
The top chart is the daily iShares Russell 2000 Index ETF (IWM), the benchmark for small-cap stocks, with a 50-Day Moving Average (MA) (blue line) and 200-Day Moving Average (MA) (red line) that traders watch and use to define trends. Day to Day volatility remained high in IWM last week, with the highest sector in Financials, including the Regional Banks. IWM gained +0.70%, closing at 171.79.
IWM remains in a downtrend, but it’s a positive sign IWM stabilized above support at 167.00 and reversed higher to close near its best level on Friday. Risk remains high, with IWM trading below two downtrends (green dotted and solid line) and the 50-Day MA (blue rectangle) and 200-Day MA (red rectangle). Resistance is at 174.00, 180.00, 184.00, and 188.00, where IWM broke down. Support is at 166.00 and 160.00.
MACD remains on a sell, with momentum beginning to flatten, and is at the most oversold level since October 2022. The Money Flow Index (MFI) in the lower chart remains in a downtrend trend (green line), falling as investors shied away from small caps. It would be a positive sign of a relief rally in the short term if IWM holds above 170.00 and breaks the March downtrend. Watch for MACD giving a buy and Money Flow, breaking the February downtrend.
Figure 11: Daily Invesco QQQ Trust (QQQ) Price (Top) and 12-26-9 MACD (Middle) and Money Flow (Bottom)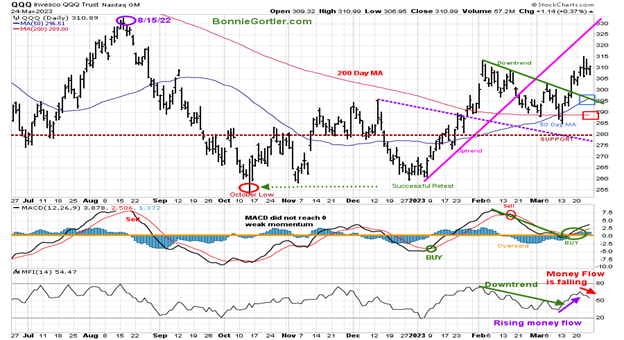
Source: Stockcharts.com
The chart shows the daily Invesco QQQ (QQQ), an exchange-traded fund based on the Nasdaq 100 Index. QQQ made a low in October 2022 (red circle), followed by a successful retest of the low in early January 2023, then broke the uptrend (pink line) after reaching a new six-month high in February.
QQQ rose +1.97% last week, at 310.89, closing above the 50-Day Moving Average and the 200-Day Moving Average (red rectangle) after breaking the February downtrend. Two of QQQs top holdings led the way. Apple (AAPL), up +3.39%, hit its highest level since September 2022, and Nvidia (NVDA), up 4.10%, hit its highest level since April 2022.
QQQ stalled at 314.00 and turned down. Resistance is at 314.00, 320.00, and 330.00, the old highs made in August 2022. Support is at 310.00, 303.00, 296.00, and 290.00. The middle chart is MACD (12, 26, 9), a measure of momentum that remains on its buy given last week, confirmed by the breaking of the February downside trendline.
The Money Flow Index (MFI) in the lower chart also broke the downtrend trend (green line) and rose, confirming the breakout in QQQ, and has started to turn down into the latest rally. QQQ will likely continue higher into the end of March. If market breadth doesn’t improve and the intermediate trend weakens, which violates the October uptrend, be alert for a possible pullback.
Figure 12: Weekly Invesco QQQ Trust (QQQ) Price (Top) and 12-26-9 MACD (Bottom)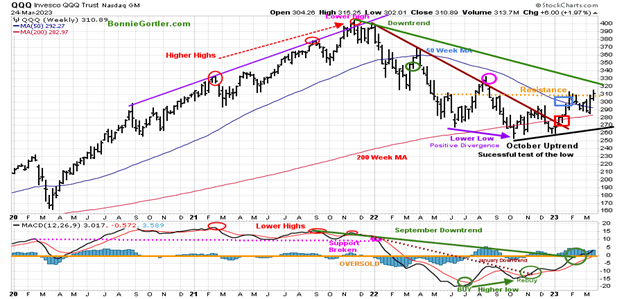
Source: Stockcharts.com
The intermediate trend remains up. Last week QQQ closed slightly above resistance at 310.00, above the 50-Week and 200-Week MA, and MACD remained above zero, and rising after breaking the September momentum downtrend, which is positive. Time will tell if QQQ has enough strength to break the 2022 price downtrend (green line top chart) above the August highs (pink circle).
The SMH intermediate trend remains up
Figure 13: Weekly Vaneck Vectors Semiconductors (SMH) Price (Top) and 12-26-9 MACD (Bottom)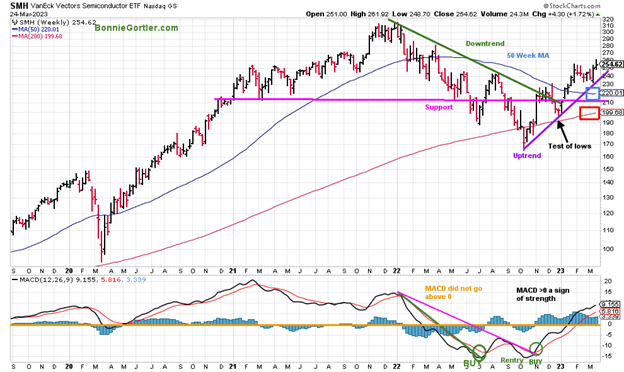
Source: Stockcharts.com
The top chart shows the Weekly Semiconductors (SMH), concentrated mainly in US-based Mega-Cap Semiconductors companies. SMH is a lead indicator for the market when investors are willing to take on increased risk and the opposite when the market is falling. SMH broke its downtrend in October 2022 and retraced the breakout in late December, testing the low with a pattern of higher lows and higher highs.
Semiconductors (SMH) rose +1.72 % last week, its highest close since last March, closing at 254.62, a leading sector in 2023, up +25.47%. Its positive SMH has remained in an intermediate uptrend since September 2022 (green line) and continues to close above its 50 and 200-Week Moving averages (blue and red rectangle), implying underlying strength. MACD, the lower chart remains on a buy, above zero, rising a sign of positive momentum.
Many times, before a correction occurs, the SMH will be a clue that there will be a decline because it will fall faster than the QQQ and lead the market lower. Watch the strength of SMH if it outperforms the QQQ, which is positive, or on the other hand, if SMH underperforms the QQQ, which would be considered short-term negative.
Figure 14: The S&P 500 Index (SPY) Daily (Top) and 12-26-9 MACD (Bottom)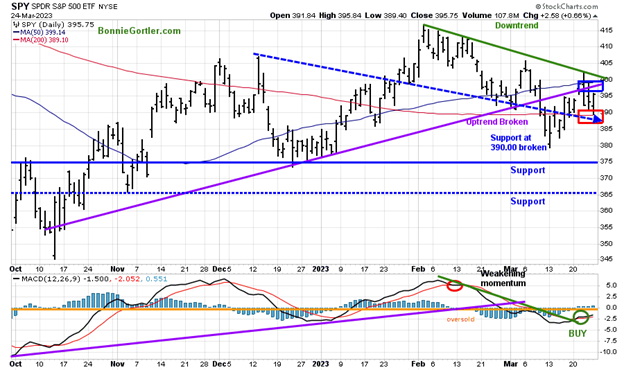
Source: Stockcharts.com
The S&P 500 (SPY) made a six-month high in early February 2023 and turned lower, making a low in March. Last week SPY rose +1.44%, closing at its high on Friday, but under the overhead, closing below the October 2022 uptrend (purple line), where it broke down. SPY remains below the 50-Day Moving Average (blue rectangle) but closed above the 200-Day Moving Average (red rectangle). MACD (bottom chart) gave a buy last week, and it’s a positive sign the downtrend from February (green line) was broken, and downside momentum has slowed. Resistance is 400.00 and 405.00. Support is at 385.00, 380.00, 375.00, and 365.00. A close below 385.00 would imply a test of its December low.
Selling pressure slowed in Financials, but volatility continued.
Figure 15: The Financial Select Sector SPDR (XLF) Daily (Top) and 12-26-9 MACD (Bottom) 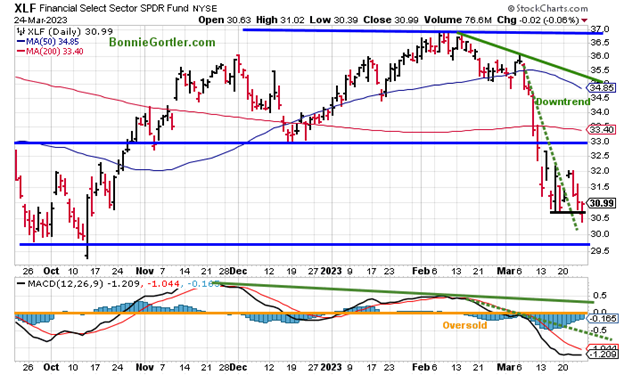
Source: Stockcharts.com
Financials (XLF) gained +0.52% in volatile trading after taking out their low for the week and closing near their high on Friday. Regional Banks (KRE), more volatile than XLF, also reversed higher to close at their high on Friday. Support is at 30.00 and 29.50. Resistance is at 31.50, 33.50, and 35.00. A short-term rally could start when investors are confident the banking sector is secure. The first rally will be sharp as many stocks have fallen substantially, and investors will go bargain hunting. However, the rally is likely, not sustainable; a safer entry, not necessarily at a lower price, will be in three to six weeks after the low occurs.
Rotation into Utilities?- Short Term-Buying Opportunity Developing
Figure 16: Utilities SPDR (XLU) Daily (Top) and 12-26-9 MACD (Bottom) 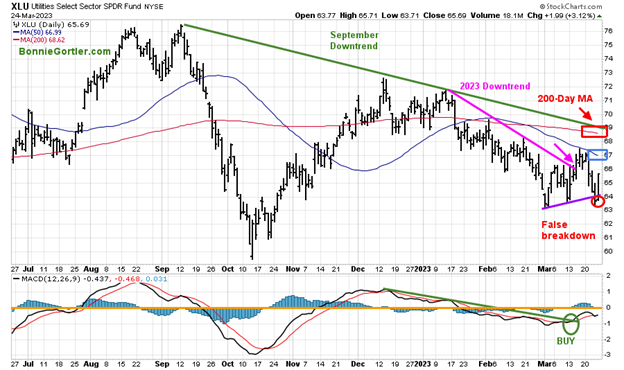
The Utilities SPDR (XLU) has been in a downtrend in 2023 that began in September 2022. XLU failed to follow through to the previous week's strength, falling -1.19%, one of the weakest sectors last week. However, after a close below 64.00 on Thursday, a false breakdown, XLU reversed sharply to close at its high on Friday, up +3.12%, the best sector for the day as money rotated into defensive sectors (XLU, XLRE, and XLP). MACD remains constructive, on a buy (green circle), rising, and a break of downside momentum since December 2022. A close above 68.00 would be positive, and a close below 63 would be negative.
Summing Up:
Day-to-day volatility remains high. Short-term technical indicators turned up from an oversold condition implying downside momentum has slowed. It was encouraging the major averages, and banking indexes reversed from their lows on Friday to close near their highs. Nasdaq continues to lead as Technology and Semiconductors remain strong as money managers favored them as end-of-quarter window dressing is this week. As long as the March lows are intact, the intermediate trend remains up, market breadth improves, and the banking crisis doesn’t worsen, higher prices are likely.
Remember to manage your risk, and your wealth will grow.
Let’s talk investing. You are invited to set up your Free 30-minute Wealth and Well-Being Strategy session by emailing me at Bonnie@BonnieGortler.com. I would love to schedule a call and connect with you.
Disclaimer: Although the information is made with a sincere effort for accuracy, it is not guaranteed that the information provided is a statement of fact. Nor can we guarantee the results of following any of the recommendations made herein. Readers are encouraged to meet with their own advisors to consider the suitability of investments for their own particular situations and for determination of their own risk levels. Past performance does not guarantee any future results.


