

Interest rate sensitive and big tech stocks are seeing positive money flows, but the market’s breadth is suddenly crashing as bond yields test their recent lows, states Joe Duarte, editor of In the Money Options.
You know trading is dull when stock traders talk about the bond market. But that’s where the action is these days, other than the Nasdaq 100, which no one pays much attention to anymore.
So as the sell in May and go away crowd starts chanting their usual seasonal song, the contrarian in me is slugging more coffee than ever to home in on whatever is working, which is limited these days.
On the macro end, even perma-bulls (are there any left?), along with those who don’t look at bond charts, can see the economy is slowing. Last week’s data was clear enough:
- A slowing rate of rise in CPI;
- A similar slowing rate of rise in PPI, with the processed goods for intermediate demand component posting a negative growth rate for the year; and
- Jobless claims hitting the highest level since they bottomed out in September 2022
Moreover, jobless claims rose the most in California, Massachusetts, Missouri, Texas, and New York. Tennessee and North Carolina, two other sunbelt states that joined Texas came in at 15 and 16 on the list. California, Massachusetts, and Texas all have heavy tech company presence.
Watching the Sunbelt
Of course, I’m keeping a close eye on the sunbelt for two reasons. First, the Sunbelt’s economy has done well over the last few years as the migration to them has bolstered housing-related industries. Second, this is where the job creation has been of late. Thus, if jobs start to falter in the Sunbelt, the odds of a recession will rise.
In Texas, the Austin area has been hit hard as the layoffs in the tech sector have extended there. Even big players like 3M (MMM) are shedding real estate in the city to go along with the phasing out of 500 jobs. 3M’s woes are not difficult to understand as its global strategy and heavy presence in China, where the post-Covid economy is still having some problems, have become its Achilles’ heel.
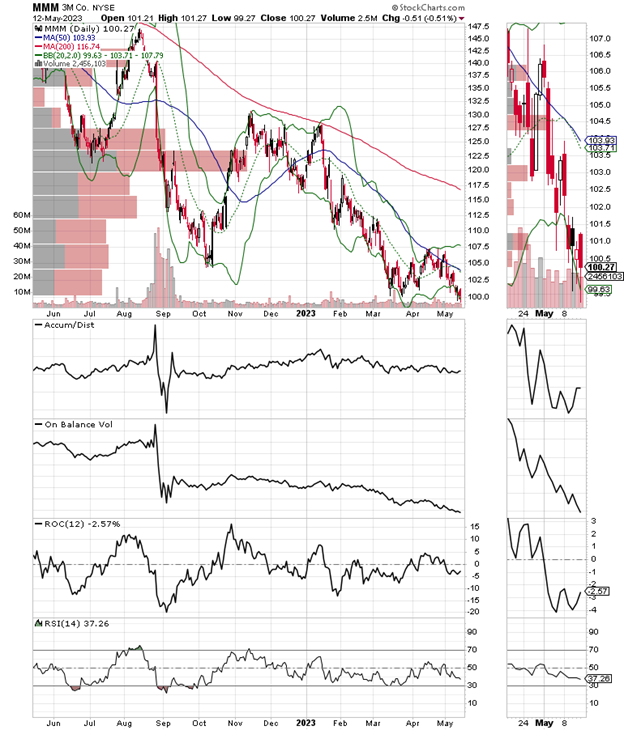
The stock continues to hover near its recent lows and is showing little sign of perking up. All of which adds up to bond traders licking their chops as they see inflation slowing, rising jobless claims, and a Federal Reserve which may be forced to stop its rate hikes; once and for all. From a trading standpoint, it’s useful to keep some money in bonds and related areas of the market. I’ve recommended several ways to do that on my service.
Bonds Hold Near New Yield Lows
The bond market is betting on a slowing economy. And last week’s data helped that viewpoint. On the other hand, bond traders aren’t fully convinced yet as the 3.3% yield continues to be the floor on yields for now. A decisive move below 3.3% would likely lead to a further decline in yields.
Certainly, that would be a positive for the bond market, but the weak data that would push yields to those levels would be significant; almost certainly weak enough to strongly suggest a recession.
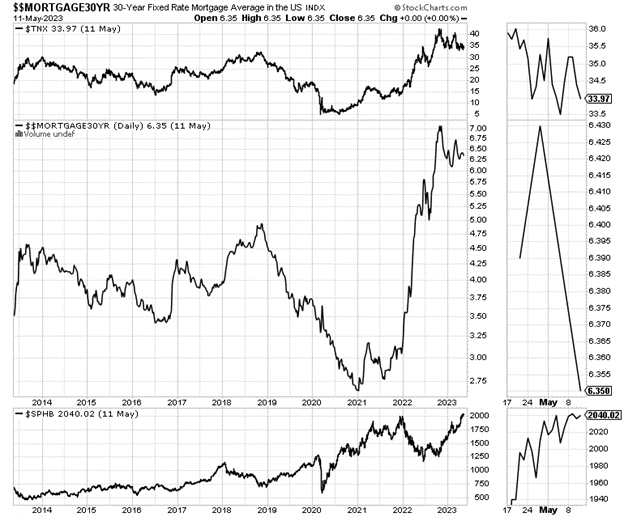
As I’ve noted here for several weeks, the long-term relationship between the U.S. Ten Year Note yield, mortgage rates, and the homebuilder sector remains intact as the recent fall in yields and mortgage rates has again led to a rise in the homebuilder sector.
Interest Rate Sensitive Sectors and Big Tech See Positive Money Flows
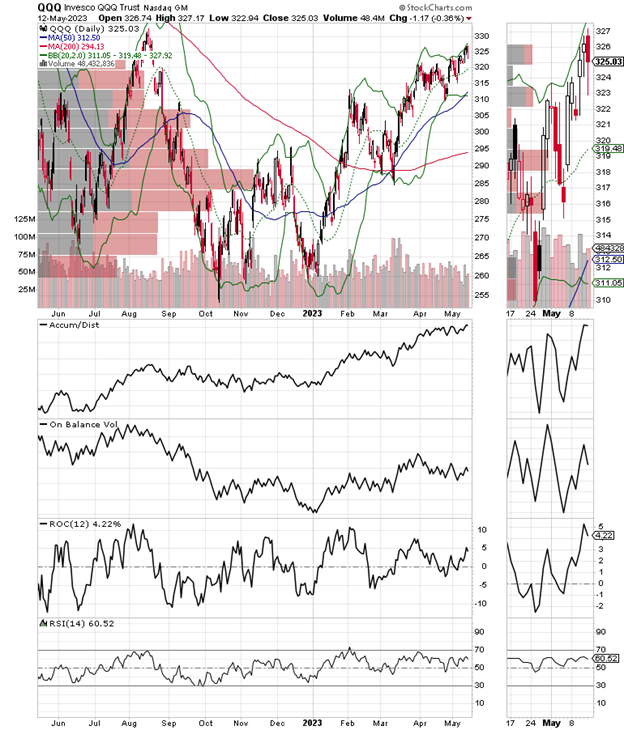
Meanwhile, traditional interest rate-sensitive sectors in the stock market are confirming the currently falling bond yields and are waiting for a break below that key 3.3% yield in TNX. In addition to the move into interest rate-sensitive areas, you can see selective money in big tech. The Invesco QQQ Trust (QQQ), home to Microsoft (MSFT), Apple (AAPL), and the rest of the big tech posse is near a major breakout as investors price in layoffs and cost-cutting measures as potential profit boosters for the companies. Moreover, there is the current AI-related buzz which is also fueling interest in the sector.
The traditionally interest rate-sensitive Utility Sector (XLU) is also answering the bond market’s siren call. XLU is trading well off of its lows and is on the verge of a breakout as it tests the key resistance level near $70. This is where the 200-day moving average and a large Volume by Price bar (VBP) are hunkered down. A move above this area would be bullish and would likely happen if TNX breaks below 3.3%.
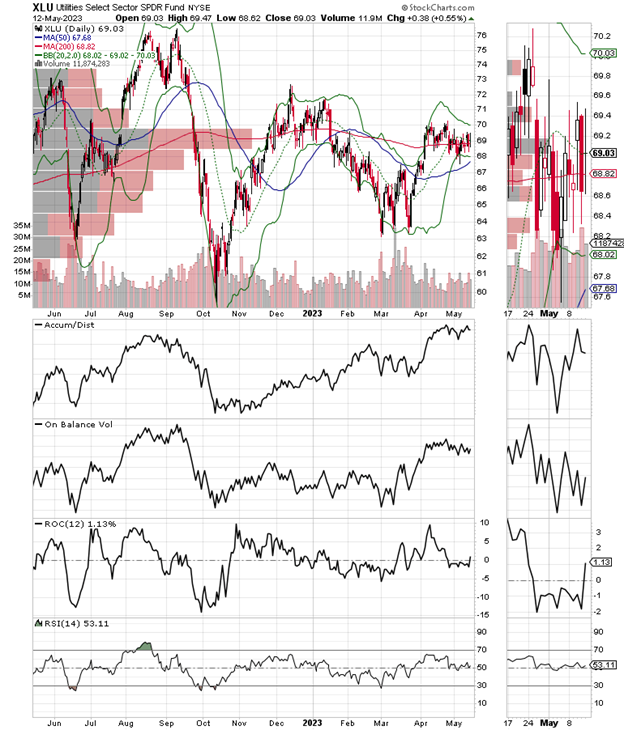
On Balance Volume (OBV) and Accumulation Distribution (ADI) are both trending higher confirming the bullish money flow.
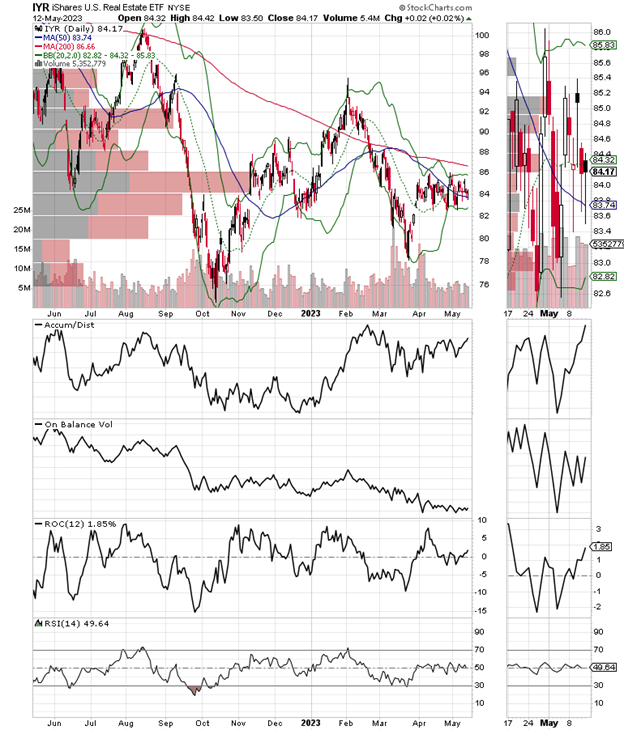
You can see a similar technical picture, albeit to a lesser degree in the real estate investment trusts. The situation in real estate is mixed as commercial real estate is struggling while the multifamily apartment and residential sector is doing much better.
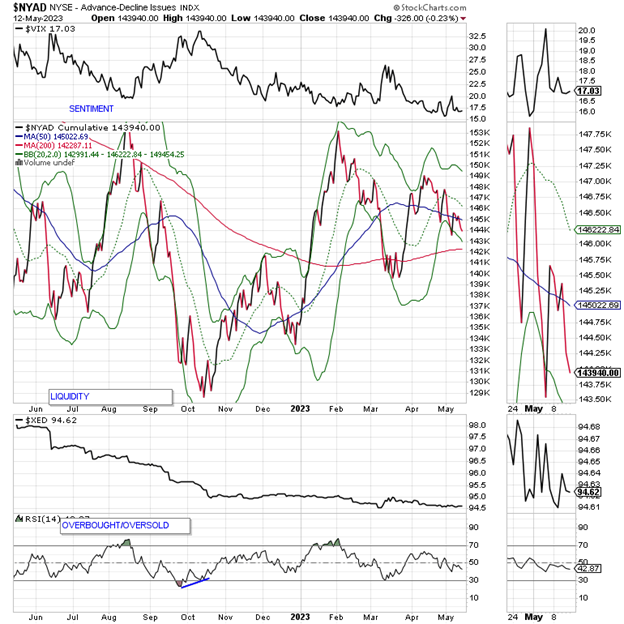
NYAD Breaks Down.
The New York Stock Exchange Advance Decline line (NYAD) rolled over at the end of last week with a nasty-looking break below its 50-day moving average. It looks headed for a test of its 200-day moving average. A sustained break below the 200-day line would be very negative for the market.
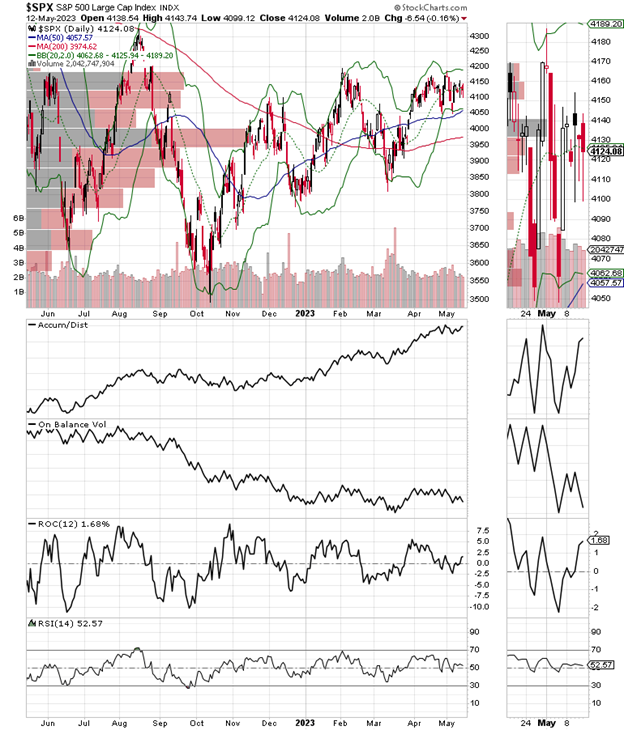
In contrast, the S&P 500 (SPX) went nowhere. The index has remained in what has become a familiar trading range, between 4100 and 4200 for several weeks as the heavily weighted big tech stocks, which are also in the Nasdaq 100 index (see below) are holding things up. On Balance Volume (OBV), however, looks to be turning lower which means sellers are starting to increase in number. Accumulation Distribution (ADI) remains very constructive for SPX, as short sellers pair positions.
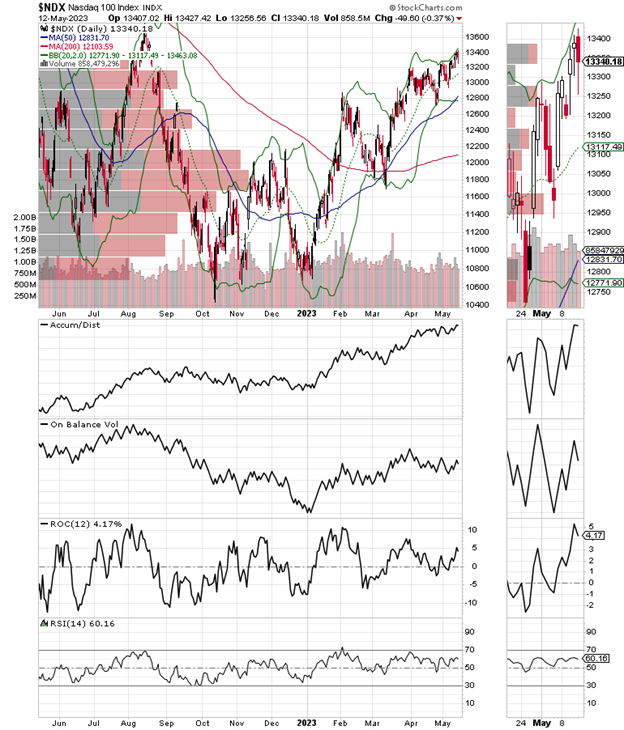
The Nasdaq 100 Index remains in an uptrend. The index closed above 13,400, extending its breakout above 13,200. I’m watching what happens to OBV and ADI in the short term, however. If they both turn lower, this rally may be ending as well.
VIX Holds Steady
The CBOE Volatility Index (VIX) has been stable lately trading well below 20. This is a positive for the markets as it shows short sellers are staying away. When VIX rises stocks tend to fall as rising put volume is a sign that market makers are selling stock index futures to hedge their put sales to the public. A fall in VIX is bullish as it means less put option buying, and it eventually leads to call buying which causes market makers to hedge by buying stock index futures raising the odds of higher stock prices.
Liquidity Remains Stable Despite Rate Hike
The market’s liquidity is moving sideways as the Eurodollar Index remains below 94.75 but did not make a new low after the Fed’s rate hike. That’s a positive for now. A move above 95 will be a bullish development. Usually, a stable or rising Eurodollar Index is very bullish for stocks. On the other hand, in the current environment, it’s more of a sign that fear is rising, and investors are raising cash.
To learn more about Joe Duarte, please visit JoeDuarteintheMoneyOptions.com.


