
For today’s Trade of the Day we will be looking at a Daily Price chart for Amazon.com (AMZN), states Chuck Hughes of Hughes Optioneering.
Amazon is an internet retailer that engages in the sale of consumer products and subscriptions through online and physical stores in North America and internationally. Now, let’s begin to break down the Daily Price chart for AMZN. Below is a Daily Price Chart with the 50-Day EMA and 100-Day EMA for AMZN:
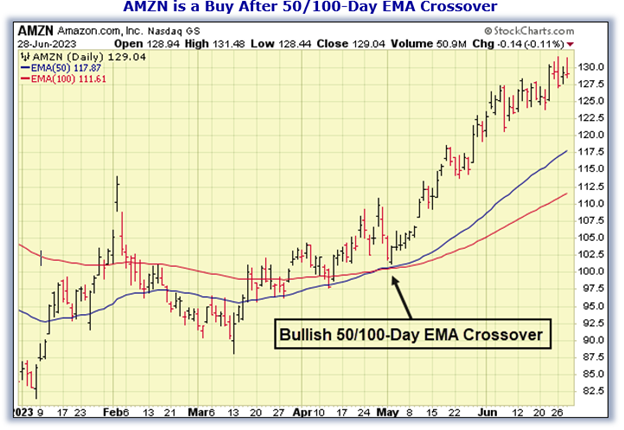
50-Day EMA and 100-Day EMA 'Buy' Signal
The 50-Day Exponential Moving Average (EMA) and 100-Day EMA are moving average indicator lines that can provide buy and sell signals when used together. When the shorter-term 50-Day EMA crosses above or below the longer-term 100-Day EMA, this provides either a buy or sell signal depending on which direction the stock price is moving.
- 50-Day EMA line Above 100-Day EMA = Price Uptrend = Buy signal
- 50 Day EMA line Below 100-Day EMA = Price Downtrend = Sell signal
When the 50-Day EMA (blue line) crosses above the 100-Day EMA (red line) this indicates that the stock’s buying pressure has begun to outweigh the selling pressure signaling a ‘buy’ signal. When the 50-Day EMA crosses below the 100-Day EMA this indicates that the selling pressure has begun to outweigh the buying pressure signaling a ‘sell’ signal.
Buy AMZN Stock
As the chart shows, on May second the AMZN 50-Day EMA crossed above the 100-Day EMA. This crossover indicated the buying pressure for AMZN stock exceeded the selling pressure. For this kind of crossover to occur, a stock has to be in a strong bullish trend. The 50-Day EMA is still above the 100-Day EMA meaning the ‘buy’ signal is still in play. As long as the 50-Day EMA remains above the 100-Day EMA, the stock is more likely to keep trading at new highs and should be purchased. Our initial price target for AMZN stock is 138.72 per share.
81.4% Profit Potential for AMZN Option
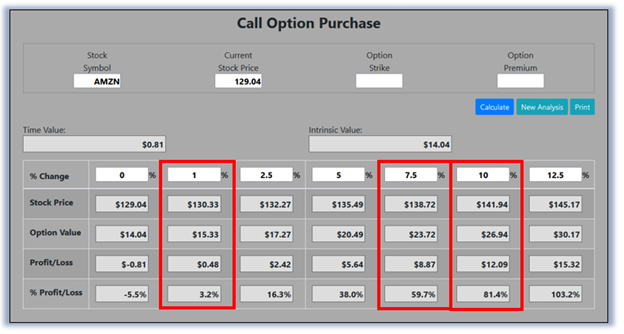
Now, since AMZN’s 50-Day EMA is trading above the 100-Day EMA and will likely rally from here, let’s use the Hughes Optioneering calculator to look at potential returns for an AMZN call option purchase. The Call Option Calculator will calculate the profit/loss potential for a call option trade based on the price change of the underlying stock/ETF at option expiration, in this example from a flat AMZN price to a 12.5% increase.
The Optioneering Team uses the 1% Rule to select an option strike price with a higher percentage of winning trades. In the following AMZN option example, we used the 1% Rule to select the AMZN option strike price but out of fairness to our paid option service subscribers we don’t list the strike price used in the profit/loss calculation. The goal of this example is to demonstrate the powerful profit potential available from trading options compared to stocks.
The prices and returns represented above were calculated based on the current stock and option pricing for AMZN on 6/28/2023 before commissions. For this specific call option, the calculator analysis below reveals if AMZN stock increases 7.5% at option expiration to 138.72 (circled), the call option would make 59.7% before the commission. And if AMZN stock increases 10.0% at option expiration to 141.94 (circled), the call option would make 81.4% before the commission and outperform the stock return by eight to one. The leverage provided by call options allows you to maximize potential returns on bullish stocks.