

Traditionally the summer months on stock exchanges are a muted affair with low volumes of trade leading to a trading slumber, but it appears the markets didn’t get the memo this year, states Ian Murphy of MurphyTrading.com.
June was a surprisingly active month and July has all the signs of continuing the frantic pace.
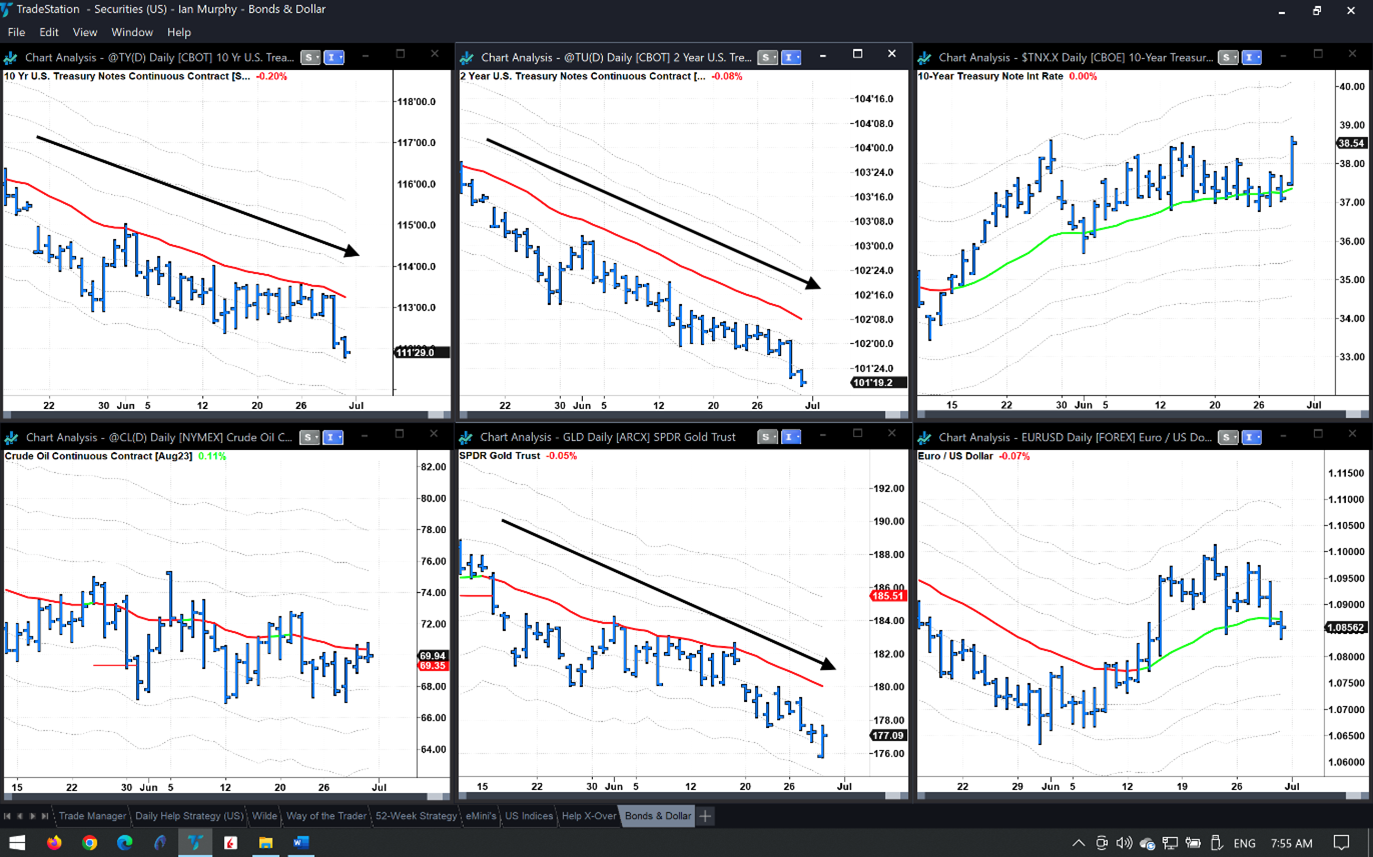
Global inflation and the resulting decision of central bankers to embark on a group interest rate hike remains the big story, but solid US growth and labor data on Thursday gave equity markets a shot in the arm. This accelerated the selloff in treasuries, and gold is also losing its luster as shown on the daily charts above.
Carnival Update
As a rule, I try to avoid offering trading tips or ideas on specific tickers and prefer to provide education and strategies so clients can operate independently. Having said that, trade ideas or specific company notes frequently generate the most feedback and debate, and they say you should give your clients what they want, so last month’s newsletter offered an in-depth analysis of Carnival Cruise (CCL) which was set up for a Gutter Trade.
The 52-Week Strategy, which is another ‘Weekly Trend Following’ style has also had a position open for a few months. Weekly styles are not the most exciting (especially when writing trading notes because nothing happens for weeks at a time), but if you can muster the discipline and patience, I guarantee you it’s a highly rewarding style and well worth learning.
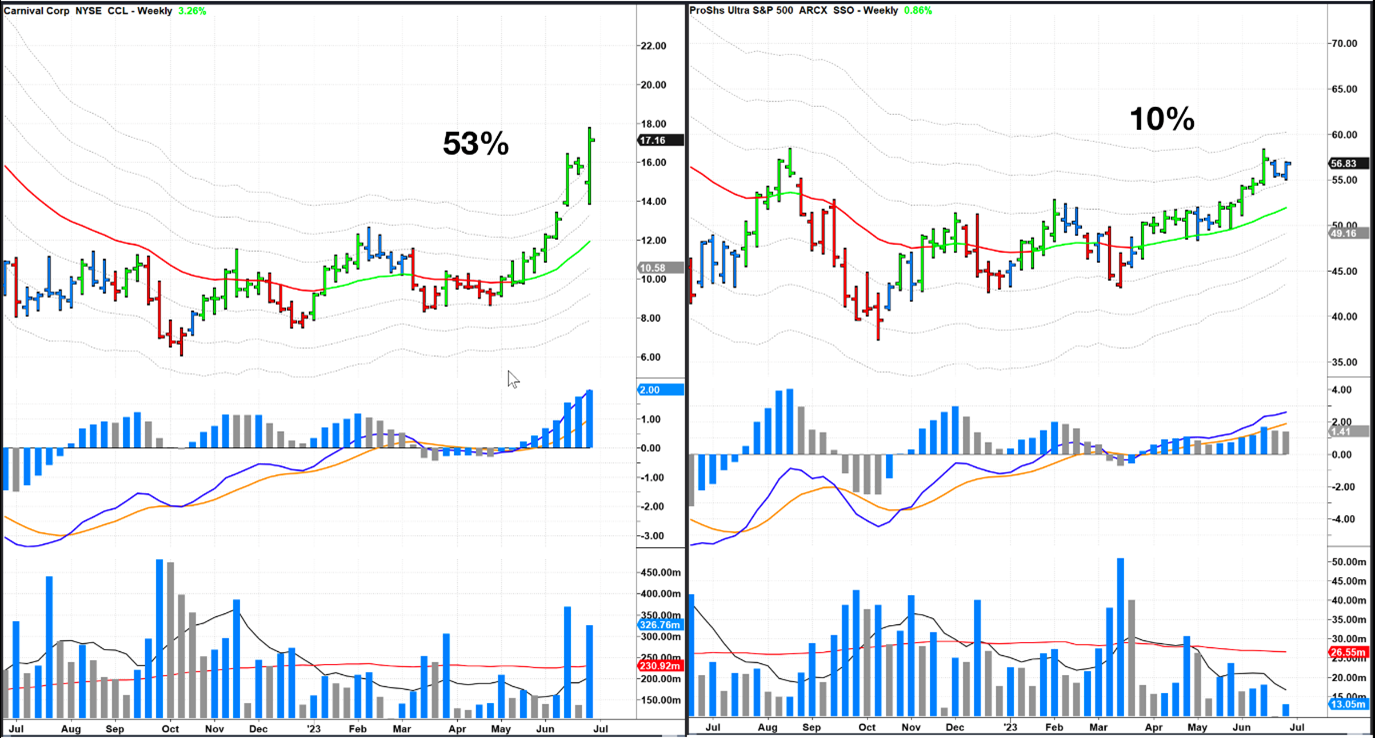
For example, since May 31 (the last newsletter), CCL has climbed 53% and ProShares Ultra S&P500 2x Shares (SSO) (the ETF used to trade the 52-Week Strategy) has risen 10%. The current soft trailing stops on both are highlighted with gray markers on the price axis. Drop me an email if you missed the June newsletter.
Daily Swing Trade
On a shorter daily timeframe, the Beauty Health Company (SKIN) offered a very attractive trade setup on Wednesday for the FBD Strategy, so I bought 2500 shares. The initial stop and targets are shown below. I would prefer to see the first target hit today as I am reluctant to carry a full size on these daily swing trades over a long weekend (US markets will close early on Monday and remain closed on Tuesday for the July fourth Independence Day holiday). I would also like to see it close the gap resistance from two weeks ago considering this stock is in a confirmed bearish trend with a high short float.
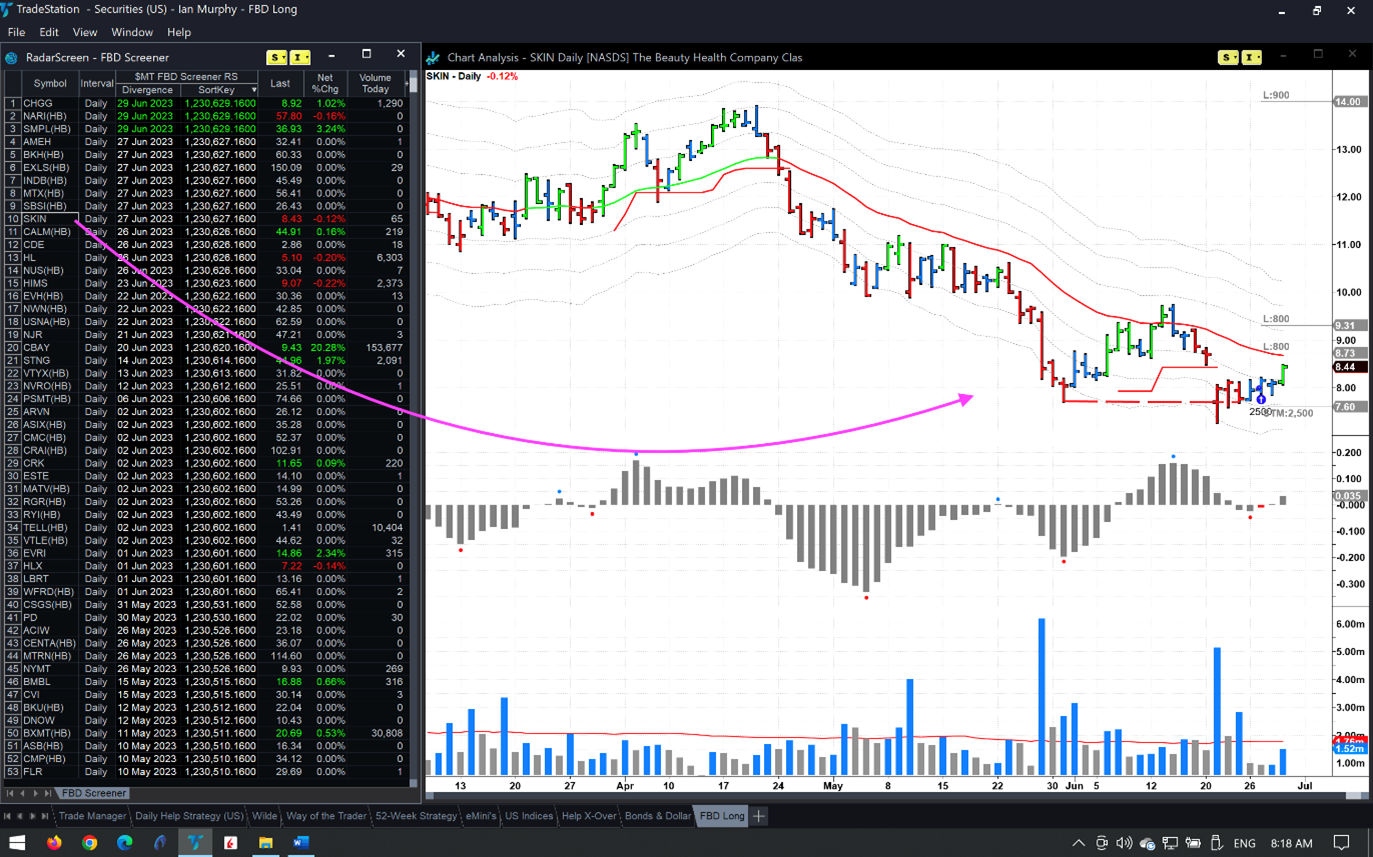
I’ve been asked recently why there is a third target showing on the chart considering the final ⅓ of the original position will be allowed to run on a trailing stop. The target order is only there for programming reasons because when you enter a bracket order in three parts each stop must have a corresponding target. When (if) ⅔ of the position has been sold I will remove the final target and just use a trailing stop order.
Help Strategy
Also on a daily chart, the Help Strategy had a ‘bull trigger’ on Wednesday (dashed green line).
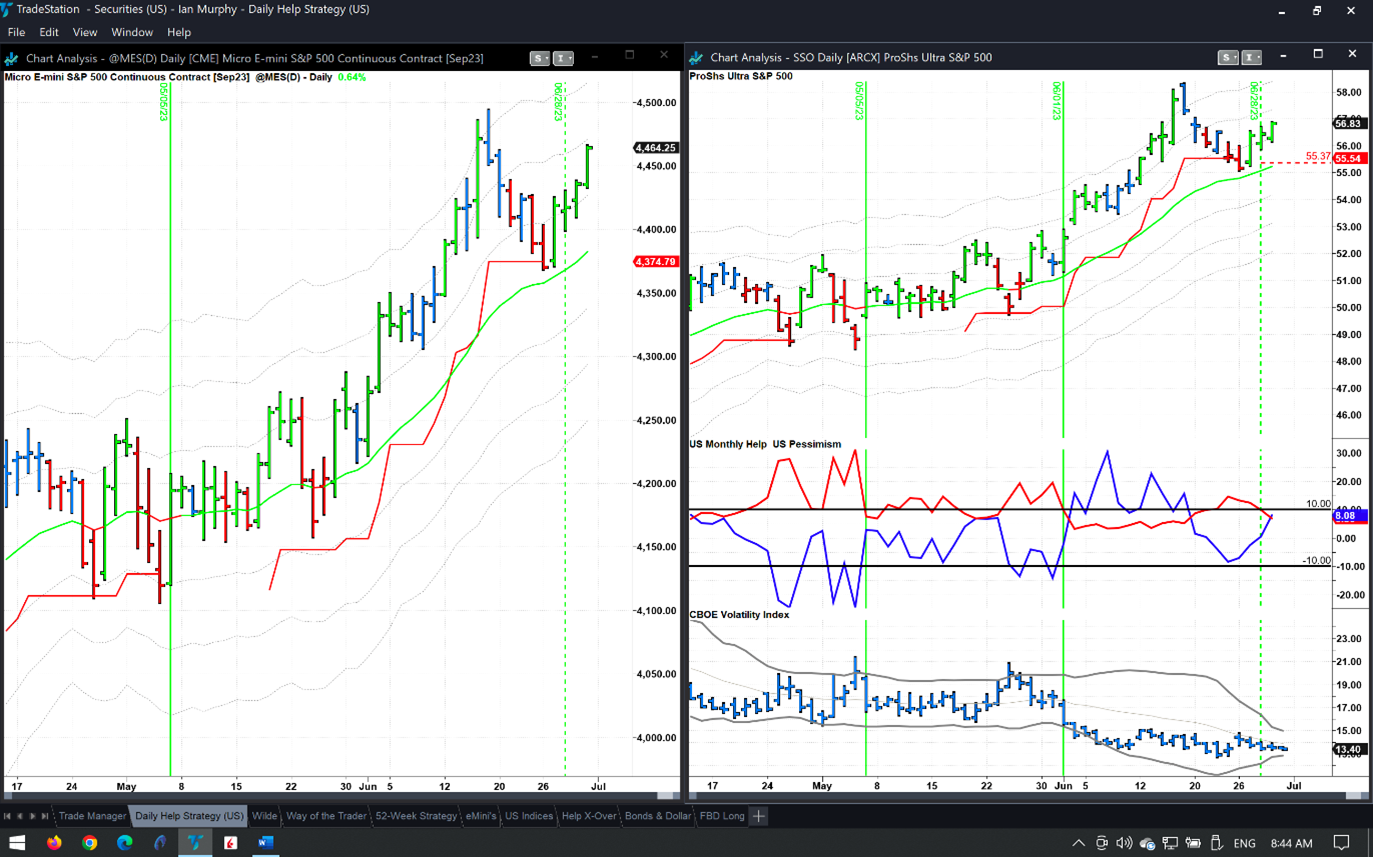
This strategy catches a short-term market bounce after a pullback, but the bullish run has been so powerful, the pullback was brief, and the Help Indicator (blue line) didn’t go out of the channel. The initial protective stop on SSO is shown with a red dashed line.
Learn more about Ian Murphy at MurphyTrading.com.


