

The chart of the day belongs to the auto retailer AutoNation (AN), states Jim Van Meerten of BarChart.com.
I found the stock by using Barchart's powerful screening functions to find stocks with the highest technical buy signals, highest Weighted Alpha, superior current momentum, and a Trend Seeker buy signal. I then used the Flipchart feature to review the charts for consistent price appreciation. Since the Trend Seeker signaled a buy on5/30 the stock gained 23.28%.
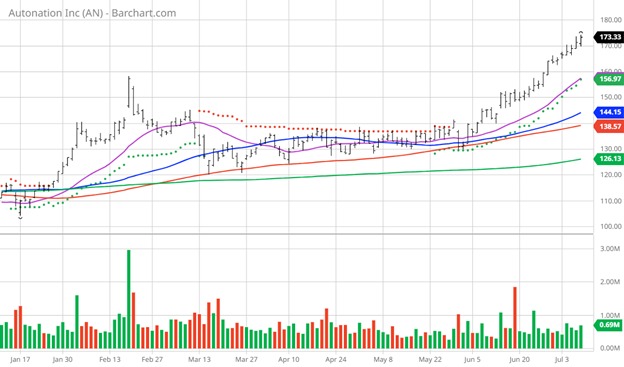 AN Price vs Daily Moving Averages
AutoNation, Inc., through its subsidiaries, operates as an automotive retailer in the United States. The company operates through three segments: Domestic, Import, and Premium Luxury. It offers a range of automotive products and services, including new and used vehicles; parts and services, such as automotive repair and maintenance, and wholesale parts and collision services. The company also provides automotive finance and insurance products comprising vehicle services and other protection products, as well as arranges finance for vehicle purchases through third-party finance sources. It owns and operates 343 new vehicle franchises from 247 stores located primarily in metropolitan markets in the Sunbelt region, as well as 55 AutoNation-branded collision centers, 13 AutoNation USA used-vehicle stores, four AutoNation-branded automotive auction operations, and three parts distribution centers. AutoNation, Inc. was incorporated in 1991 and is headquartered in Fort Lauderdale, Florida.
Barchart's Opinion Trading systems are listed below. Please note that the Barchart Opinion indicators are updated live during the session every 20 minutes and can therefore change during the day as the market fluctuates. The indicator numbers shown below therefore may not match what you see live on the website when you read this report.
Barchart Technical Indicators:
- 100% technical buy signals
- 65.18+ Weighted Alpha
- 52.31% gain in the last year
- Trend Seeker buy signal
- Above its 20, 50, and 100-day moving averages
- 13 new highs and up 22.09% in the last month
- Relative Strength Index 80.50%
- The technical support level at $170.71
- Recently traded at $173.33 with a 50-day moving average of $144.15
Fundamental Factors:
- Market Cap $7.81 billion
- Revenue is projected to decrease by 2.30% this year and increase again by 2.60% next year
- Earnings are estimated to decrease 8.50% this year, and decrease an additional 6.70% next year but compound upward at an annual rate of 24.70% for the next five years
Analysts and Investor Sentiment—I don't buy stocks because everyone else is buying but I do realize that if major firms and investors are dumping a stock it's hard to make money swimming against the tide:
- Wall Street analysts gave five strong buy, one buy, four hold, and two sell opinions on the stock
- Analysts' price targets are between $96 and $245—a very wide range
- The individual investors on Motley Fool are high on the stock and voted 189 to 63 for the stock to beat the market with the more experienced investors voting 41 to eight for the same result
- Value Line ranks the stock an average of three with a price target of $140 for a loss
- CFRAs MarketScope rates it a five-star buy with a price target of $180
- 10,820 investors monitor the stock on Seeking Alpha
Disclosure: I/we have no stock, option, or similar derivative position in any of the companies mentioned, but may initiate a beneficial Long position through a purchase of the stock, or the purchase of call options or similar derivatives in the next 72 hours.
Additional Disclosure: The Barchart Chart of the Day highlights stocks that are experiencing exceptional current price appreciation. They are not intended to be buy recommendations as these stocks are extremely volatile and speculative. Should you decide to add one of these stocks to your investment portfolio it is highly suggested you follow a predetermined diversification and moving stop loss discipline that is consistent with your personal investment risk tolerance and reevaluate your stop losses at least every week.
Learn more about Jim Van Meerten at BarChart.com.


