

The EUR/USD has spent the last three and a half days inside a tight consolidation range, holding onto much of the big gains from last week, states Fawad Razaqzada of Trading Candles.
The further weakness in US data—most notably, industrial output—that we saw on Tuesday was offset by dovish comments from ECB’s Klaas Knot, who said that monetary tightening beyond next week’s meeting is not guaranteed, pushing back against market expectations for a September increase. But with the dollar managing to regain some lost ground against other currencies, most notably the pound as this morning’s weaker UK inflation data saw investors scale back bets of aggressive BOE tightening, the EUR/USD could be about to stage a deeper pullback ahead of next week’s big central bank meetings.
Still, the prospects of one final rate hike from the Fed plus possibly two more from the ECB could keep the downside limited. So, while there is a possibly of some short-term weakness, the tightening of rate differentials between the US and Eurozone monetary policies should keep the EUR/USD supported on the dips. An eventual move towards 1.15 is potentially underway, although it could be a while before we potentially get there given the increased risks of some short-term weakness first.
Dollar Rebounds From Oversold Levels
It has been a good day for the dollar so far, rising sharply against the pound and yen, and adding to its recovery against the antipodean currencies today. The dollar index was off a 15-month low, in other words, as the stay below 100.00 proved to be short-lived—at least for now. The dollar was oversold in the short-term outlook, so a bit of position squaring and speculative buying ahead of the FOMC was always likely.
The US dollar recovery comes on the back of a terrible week for the greenback. The narrative that the Federal Reserve is winning the fight against inflation got a boost as both CPI and PPI came in weaker than expected last week, causing the Dollar Index to fall below 100.
But it has since started to find come love again. On Friday afternoon, we saw the release of the UoM consumer sentiment and inflation expectations indices, which came out higher than expected. The 1-year Inflation Expectations printed 3.4% vs. 3.1% expected, which would suggest inflation could remain sticky, requiring the contractionary monetary policy to be in place longer. And then on Tuesday, the latest retail sales data revealed a mixed picture as the June figures came in weaker, but the data for May got revised higher, suggesting the US consumer remains relatively strong. Indeed, retail sales control rose by 0.6% m/m, defying forecasts of a fall of 0.3%.
What to Look Out for the Rest of the Week
Looking ahead, US housing data will be in focus with building permits and housing starts due to be released at 13:30 BST. On Thursday, we will have the weekly jobless claims, Philly Fed Manufacturing index, and existing home sales. But with much bigger events taking place next week, don’t expect any wild swings on the back of these figures.
From the eurozone, well there’s not an awful lot to drive the EUR/USD pair much this week. Monday’s PMI numbers could be the last major macro releases before the focus turns to the FOMC and ECB meetings on Wednesday and Thursday, respectively. Ahead of these central bank meetings, we have also entered a blackout period for ECB and FOMC officials.
EUR/USD Technical Analysis
With the EUR/USD overbought in the short-term, don’t be surprised to see some weakness come into play here around the long-term 61.8% Fibonacci retracement level against the 2021-2022 downswing, at 1.1275. However, the longer-term EUR/USD outlook remains positive. The explosive breakout we saw last week suggests the EUR/USD bulls will likely remain in control of price action for a while yet, especially as the long-term trend is also bullish—look no further than the slope of the 200-day moving average.
Interestingly, there’s a Fibonacci-based price action in the making, namely a harmonic Butterfly—see the annotation on the chart. With price points X, A, B, and C already established, the key question is where will point “D” occur. This is usually where the price finds resistance and turns lower. Fibonacci extension levels can be our guide. The 127.2% extension of the BC leg comes in at 1.1220. Here, we have also seen some resistance, so it could be that point D has already been reached, and a short-term top is in play.
But given the sharper move in this CD leg compared to the AB wave, I wouldn’t be surprised if the CD leg turns out to be bigger than the AB leg. Thus, a continuation towards the 161.8% Fibonacci extension level at 1.1380 is possible, before we potentially see a temporary or a long-term top in the EUR/USD.
In terms of support, last Wednesday’s high at 1.1140 is now very important to hold insofar as the short-term EUR/USD outlook is concerned. If that breaks, then the April high at 1.1095 will be the next level to potentially provide support or else we will see a revisit of the more significant support around the 1.10 handle.
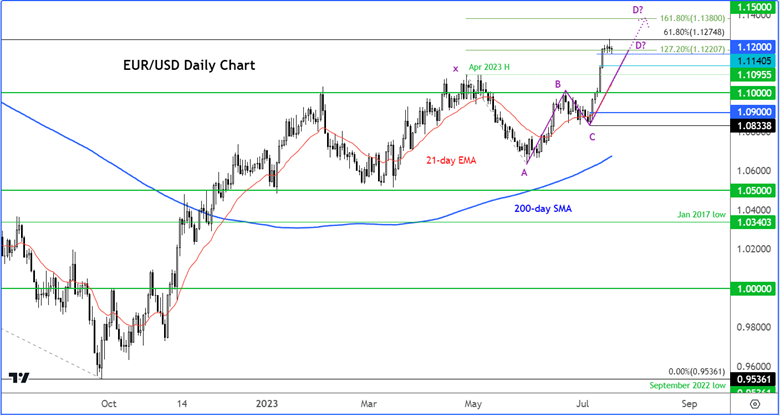
Source: TradingView.com
To learn more about Fawad Razaqzada visit TradingCandles.com.


