

The theory behind trading stocks is straightforward, states Ian Murphy of MurphyTrading.com.
Learn a trading style, get a few strategies for that style, practice a little, and off you go! In reality, it’s rarely that simple because we constantly encounter challenging situations and “this never happened before” scenarios. Technical analysis and the associated charts will only get you so far, and sometimes we must bend the rules or adjust on the fly because the underlying momentum driving stock prices is emotional, not technical. This is where the “art” part of trading comes in because we need to mimic an artist’s ability to identify the form and hidden structure in a cloudy and confusing scenario.
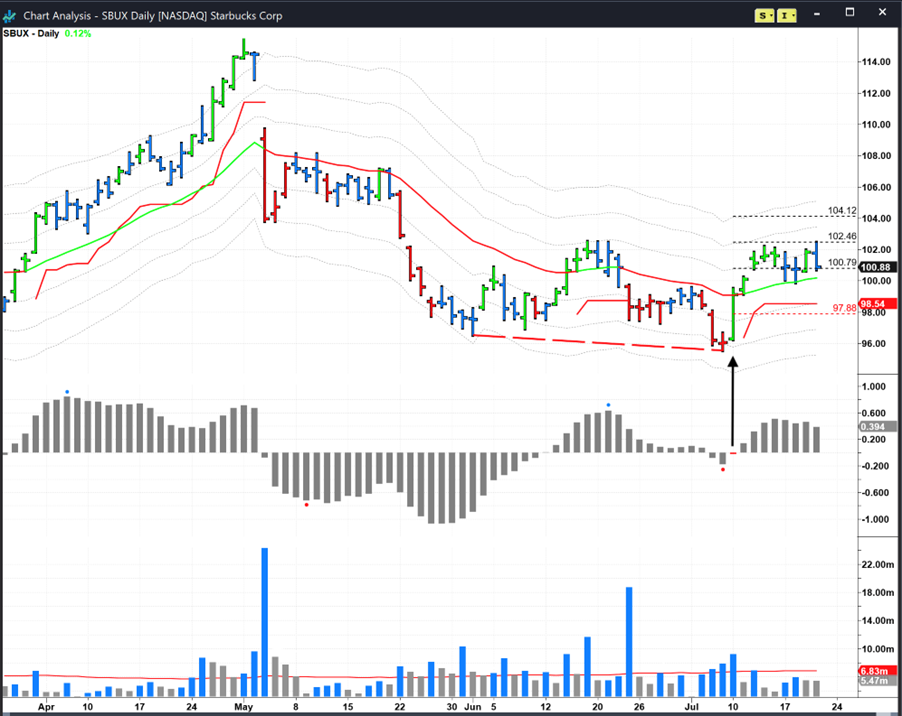
A previous daily swing trade in Starbucks (SBUX) offered a perfect example. A false downside breakout on price on July 10th was accompanied by bullish divergences on MACDH and ATR channels (FBD strategy, red dashed line). However, the price bar that triggered the entry was so tall that an initial protective stop placed 0.5ATR under it was so far away from the first target (lower black dashed line) that a reversal at that point would have been loss-making. If all three targets were hit, the reward would not have been worth the risk. What to do?
The best solution in this scenario is to place the initial protective stop at a 50% retrace of the trigger bar (red dashed line) because we know that a tall bullish bar rarely gives up half its gain if the trend has changed to the upside—placing the stop here means the risk/reward ratio makes sense. As it happens, the first two targets were reached so the risk was worth it.
Learn more about Ian Murphy at MurphyTrading.com.


