

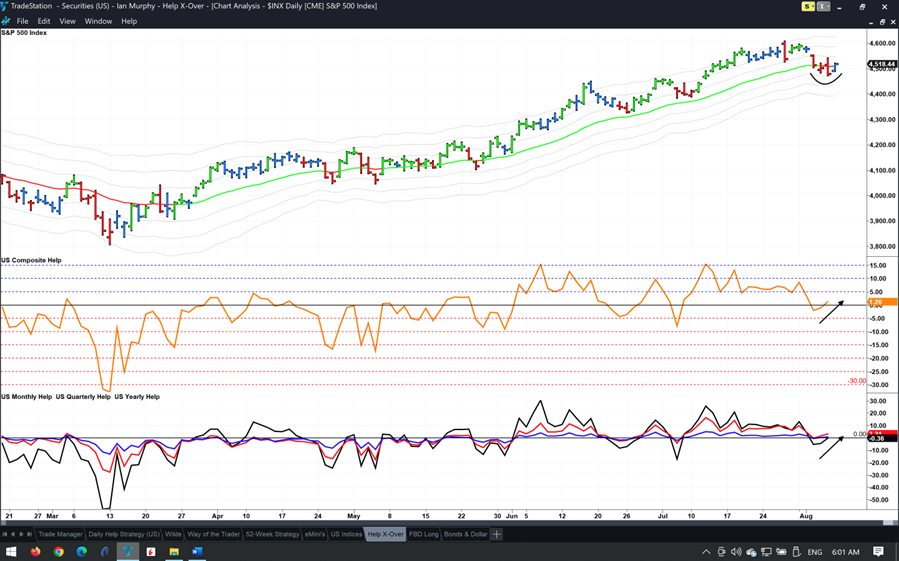
The Trading Note on July 28 highlighted some levels to watch on the S&P 500 (SPX) to confirm if a pullback was going to be a trend changer or just a brief pressure release, states Ian Murphy of MurphyTrading.com.
On a daily chart, Friday’s positive bar which closed back above the EMA having found support at the -1ATR appears to suggest this was a brief pullback in the bullish trend. The Composite Help Indicator, which is a merger of yearly, quarterly, and monthly new highs and new lows is also back above zero, another positive sign. Let’s see what the remainder of the week brings.
The weekend note which suggested adding Vanguard’s Real Estate ETF (VNQ) to a weekly trend following watchlist because it may turn out like Carnival Cruise (CCL) prompted queries if an entry on the latter was still possible at this late stage—it is.
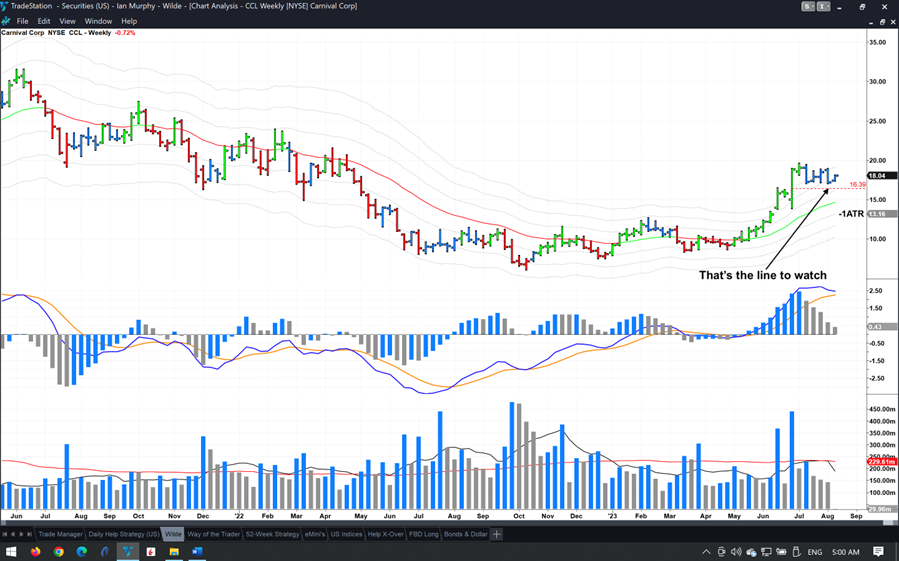
Using a 50% retrace of the tall price bar as a soft stop ($16.39), we can enter if this week’s price bar closes positive and closes above the retrace line. Then going forward, we switch to the -1ATR line when it gets above the 50% line.
Learn more about Ian Murphy at MurphyTrading.com.


