

A few eagle-eyed Clients have drawn my attention to a bearish divergence between the S&P 500 (SPX) and Composite Help before this week’s pullback. Well spotted, states Ian Murphy of MurphyTrading.com.
This is a perfect example of why new highs and lows are a ‘leading market indicator’, they give a signal before the market moves. To identify a divergence, be it bearish at the top or bullish at the bottom, we look for peaks to form and then for the price (or line) to reverse.
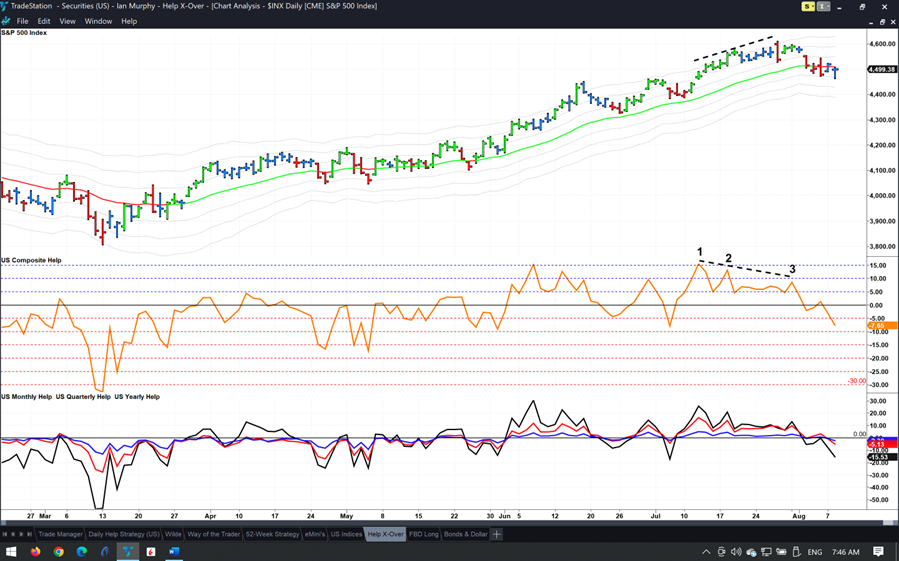
For example, on the chart above the S&P 500 made a series of higher highs between July 12 and 27 (top dashed line). Meanwhile, Composite Help (which looks at all 5000-ish US stocks and not just the 500 heavyweights in the S&P 500 index) made three corresponding peaks over the period but each peak was lower than the previous one—that’s the divergence.
There is no doubt it can be a pain in the ass to source and plot NHNL data day after day, but this is why we do it, we had a clear signal that a pullback was coming two days in advance!
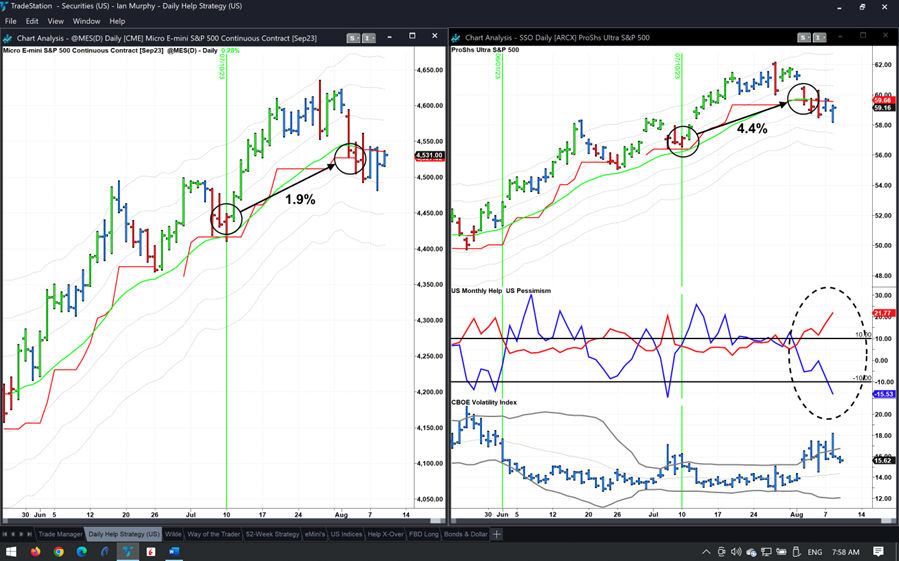
We last reviewed the Help Strategy in the Newsletter on August first. The pullback stopped out the current trigger for a profit of 4.4% on ProShares Ultra S&P500 2x Shares (SSO) and 1.9% on Micro E-mini futures assuming both full positions were carried to the end. Knowing what we did from the divergence on Composite, the info would have allowed us to close out the trade early or at least not to increase the position.
Now we wait for Pessimism and Help (dashed oval) to finish their adventures outside the channel, and for them to return to where they belong so we can make another trade.
Learn more about Ian Murphy at MurphyTrading.com.


