

The Chart of the Day belongs to the homebuilder M/I Homes (MHO), states Jim Van Meerten of BarChart.com.
I found the stock by using Barchart's powerful screening functions to find stocks with the highest technical buy signals, highest Weighted Alpha, superior current momentum, and having a Trend Seeker buy signal then used the Flipchart feature to review the charts for consistent price appreciation. Since the Trend Seeker signaled a buy on 7/11 the stock gained 19.11%.
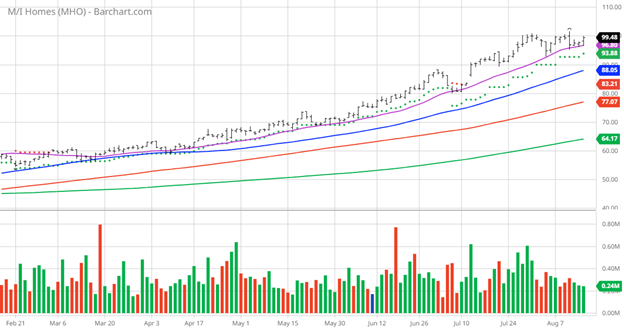
HMO Price vs Daily Moving Averages
M/I Homes, Inc., together with its subsidiaries, operates as a builder of single-family homes in Ohio, Indiana, Illinois, Minnesota, Michigan, Florida, Texas, North Carolina, and Tennessee. The company operates through Northern Homebuilding, Southern Homebuilding, and Financial Services segments. It also designs, constructs, markets, and sells single-family homes and attached townhomes to first-time, millennial, move-up, empty-nester, and luxury buyers under the M/I Homes brand name. In addition, the company purchases undeveloped land to develop into lots for the construction of single-family homes, as well as for sale to others. Further, it originates and sells mortgages; and serves as a title insurance agent by providing title insurance policies, examination, and closing services to purchasers of its homes. M/I Homes, Inc. was founded in 1976 and is based in Columbus, Ohio.
Barchart's Opinion Trading systems are listed below. Please note that the Barchart Opinion indicators are updated live during the session every 20 minutes and can therefore change during the day as the market fluctuates. The indicator numbers shown below therefore may not match what you see live on the Barchart.com website when you read this report.
Barchart Technical Indicators:
- 100% technical buy signals
- 143.41+ Weighted Alpha
- 108.16% gain in the last year
- Trend Seeker buy signal
- Above its 20, 50 and 100 day moving averages
- 10 new highs and up 8.14% in the last month
- Relative Strength Index 64.44%
- Technical support level at $97.35
- Recently traded at $99.48 with 50 day moving average of $88.05
Fundamental Factors:
- Market Cap $2.72 billion
- P/E 5.55
- Revenue expected to grow by 3.00% this year and another 8.70% next year
- Earnings estimated to increase an additional 7.90% next year and continue to compound at an annual rate of 12.50% for the next five years
Analysts and Investor Sentiment - I don't buy stocks because everyone else is buying but I do realize that if major firms and investors are dumping a stock it's hard to make money swimming against the tide:
- Wall Street analysts gave 2 strong buy and 1 buy opinions on the stock
- Analysts gave price targets of $71 to $116
- The individual investors following the stock on Motley Fool voted 100 to 196 for the stock to lag the market with their most experienced investors voting 31 to 41 for the same result
- Value Line rates it an above average 2
- CFRAs MarketScope rates it a strong buy
- 7,380 investors monitor the stock on Seeking Alpha
Disclosure: I/we have no stock, option or similar derivative position in any of the companies mentioned, but may initiate a beneficial long position through a purchase of the stock, or the purchase of call options or similar derivatives in the next 72 hours.
Additional disclosure: The Barchart Chart of the Day highlights stocks that are experiencing exceptional current price appreciation. They are not intended to be buy recommendations as these stocks are extremely volatile and speculative. Should you decide to add one of these stocks to your investment portfolio it is highly suggested you follow a predetermined diversification and moving stop loss discipline that is consistent with your personal investment risk tolerance and reevaluate your stop losses at least on a weekly basis.
Learn more about Jim Van Meerten at BarChart.com.


