

As a technician, I use many tools and techniques that provide me with quality information about the current market situation, states Bob Lang of ExplosiveOptions.net.
Of course, indicators are not perfect, and they should often be used in combination with each other. One tool I highly recommend adding to your toolkit is oscillators. Oscillators show you shifts in sentiment in the indexes and thus help you analyze the strength of an index’s trend. Let’s take a look at three today.
McClellan Oscillator
The McClellan Oscillator looks at daily breadth (issues up versus issues down) by market (SPX 500, Nasdaq, etc.) and accumulates the data in different formats. A reading above zero helps confirm a rise in the index; readings below zero confirm a decline. When the index is rising but the oscillator is falling, it’s a sign that the index could start declining too. The converse is also true: When the index is falling and the oscillator is rising, the index could start rising soon as well.
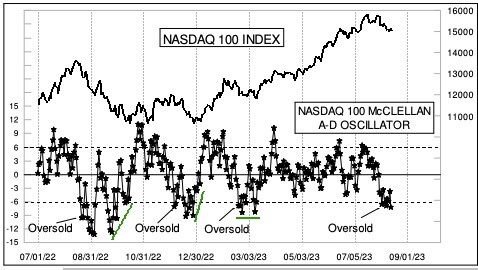
A/D Oscillator
The Accumulation/Distribution (A/D) Oscillator moves up or down based on the breadth numbers from the NYSE and Nasdaq. It is the difference between two trend lines (10% and 5%) and represents sentiment differentials from previous days. When the oscillator is moving higher and reaches overbought readings, a decline in the index is likely to happen very soon. Conversely, when a deep oversold reading occurs (see the chart below of the Nasdaq 100 oscillator) a rally is likely to ensue within days.
Summation Index
The Summation Index, also created by the McClellans, is a running total of the oscillator numbers. It tells us when big-picture market shifts are happening, when we should apply more pressure to the bullish or bearish side, and when crossovers occur around the zero line. When it is climbing, you can feel confident that the uptrend can continue. When it starts to roll over, that is your sign to start cutting back on positions – a corrective move is about to occur. In short, it’s an excellent trending tool. All three of these oscillators confirm when markets are at extremes. And when markets are at extremes (overbought or oversold), it’s fairly safe to go against the tide.
Learn more about Bob Lang at ExplosiveOptions.net.


