

It’s Labor Day in the US and this public holiday traditionally bookends the slack summer period in equity markets, states Ian Murphy of MurphyTrading.com.
As the kids head back to school, traders and investors return to their screens and there is always a corresponding uptick in queries arriving in my inbox. One of the questions I recently received that applies to all traders: “How do you handle a position in a stock that skyrockets upwards (e.g... NVIDIA Corporation (NVDA))? I want to stay in for more profit but I’m always afraid it will crash, and I’ll lose what I’ve already gained.”
Composite Strategy
Whenever I’ve been away from the charts for a while and want to quickly get up to speed on the current trend in US stocks, I immediately reach for the Composite Indicator because it tells you everything you need to know at a glance.
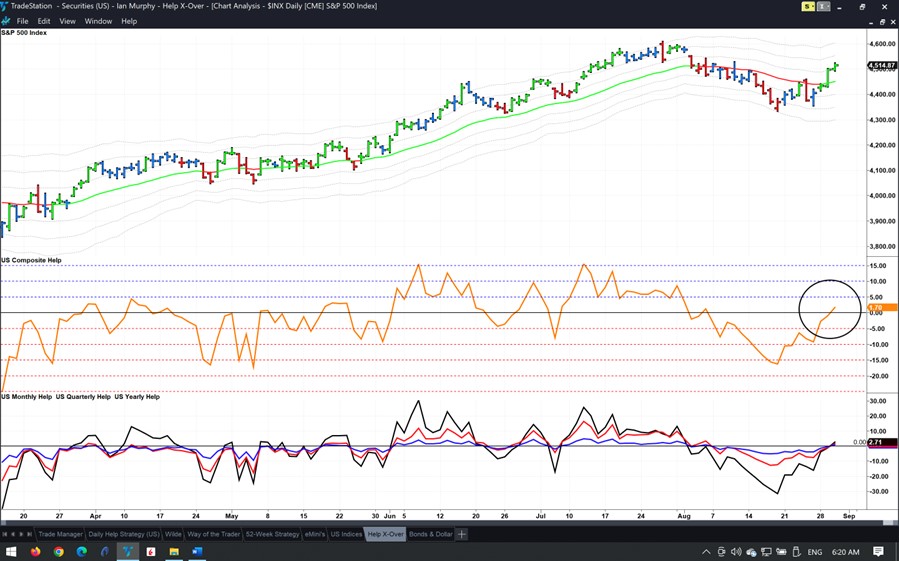
Last week’s bullish action on the S&P 500 (SPX) saw the indicator cross back above the zero line from below (circle), and this matters because every new bullish trend begins with this signal. It’s not a guarantee of a new bull market, and the trend could change tomorrow, but every bullish move has a crossover like this in its infancy.
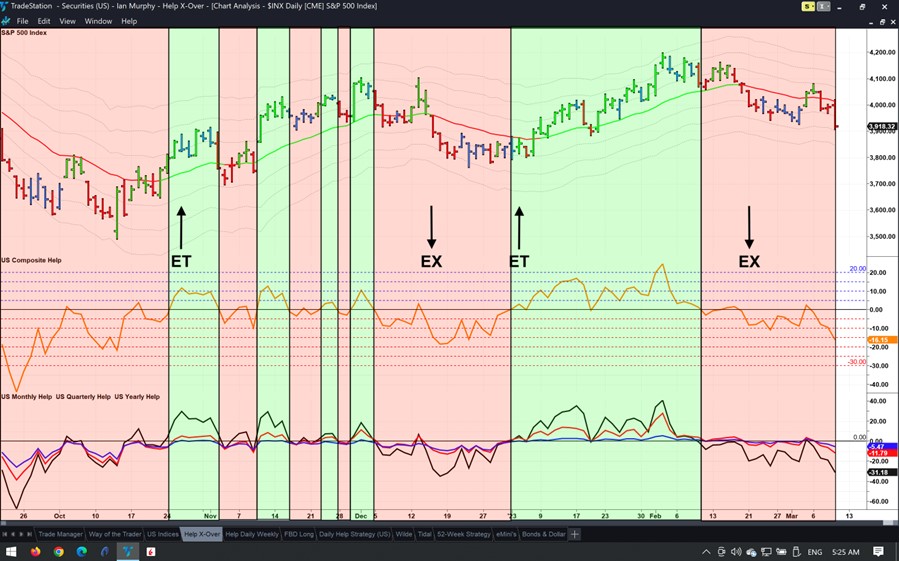
Not only does Composite allow us to get ahead of the market, but it also offers trading signals. For example, the chart above was shared with Subscription Clients on March 10. Ignore the entry and exit arrows for a moment and concentrate instead on the red and green bands. When the Composite is above the zero line the band is green and the market is bullish, below zero the market is bearish in a red band. Notice how Composite crosses the zero line just before or at the beginning of a trend change - this is why it’s such an excellent ‘leading market indicator’.
Now look at the arrows, these are entry and exit triggers for a daily trend-following strategy based on the crossover. When the Composite crosses zero from below we enter long on an ETF that tracks the S&P500 or on futures (ET arrow) and when the S&P500 closes below the -1ATR line we exit (EX). Look at the entry and exit prices—this is a highly profitable approach.
Help Strategy
The old reliable keeps churning out the goods, especially in a year like this when we’ve had numerous short-term market bounces. The latest trigger occurred on Monday (vertical green line) and the first two targets on SSO were reached by 11:00 ET (dashed lines). The trailing stop moved above the entry, meaning it’s almost impossible for this trade to lose money now.
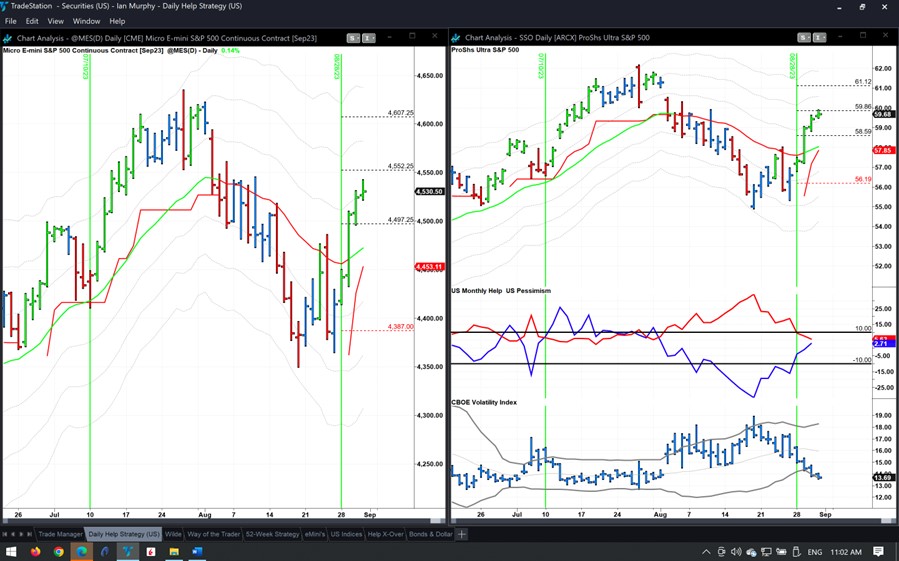
There is an abundance of methods to trade these bounces but the back-tested data for the strategy is based on a fixed $50k account risking 2% ($1000) per trade with the initial protective stop set 0.5ATR below the low of the price bar of the trigger (red dashed line). Then, the full position is carried to the end until it stops.
Due to the narrow range of Monday’s price bar, the position size would be large on this one because the distance in dollars from entry and stop was tight. Also, because of the liquidity in SSO and Micro E-mini futures, traders with a higher risk tolerance frequently waive the ‘20% Limit of Risk’ rule on this strategy and put their entire account in the trade. If they did, they are now sitting on some serious profit and the moment of highest risk has passed.
Learn more about Ian Murphy at MurphyTrading.com.


