

One of the biggest challenges traders face is deciding which indices and indicators to trust when uncertainty clouds the market, states Ian Murphy of MurphyTrading.com.
We can easily fall into the mistaken belief that we should fill our screens to gain as much insight as possible, but this is counterproductive because most technical tools repeat the same message, but from a different perspective.
We must whittle all the available lines, graphs, and charts down to a handful we trust and return to these for guidance. My preference for counting stocks making new highs and lows over three timeframes is well documented, but other freely available indices should not be overlooked.
For example, when looking at US stocks, the Russell 2000 Index of mid-caps captures what’s happening among smaller firms on Main Street, and these firms are usually the first to feel the squeeze (or boom) in the economy.
The Dow Jones Transportation Index (TRAN) is another ‘must have’ indicator for US equities because people stop traveling or moving stuff at the beginning of a slowdown, and do the reverse when life is looking rosy.
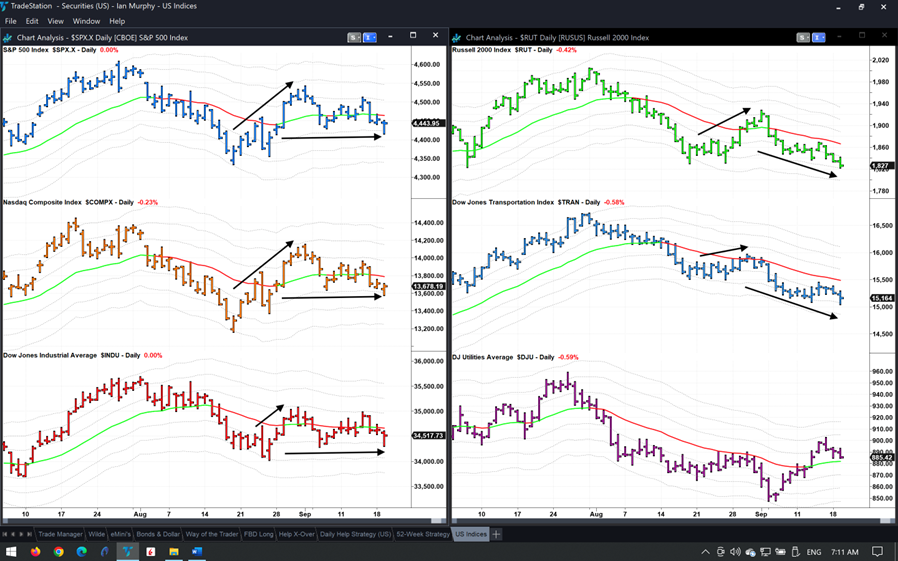
Looking at the daily charts above, there is a clear difference between the most popular indices on the left and the less well-trodden on the right. Focusing on the stock market rally at the end of August (up arrows), the S&P, NASDAQ, and DOW met resistance at the one and 2ATR lines but trended sideways ever since, they are not sure what to do next. However, RUT and TRAN (top and middle right) have been in a classic bearish trend since they topped out on July 31 and know exactly where they are going, and that’s firmly south!
Learn more about Ian Murphy at MurphyTrading.com.


