

Political shenanigans in Washington D.C. are once again to the fore as a short-term spending bill was dramatically dragged over the line at the weekend, states Ian Murphy of MurphyTrading.com.
Against this backdrop (not to mention the auto workers’ strike) it will be increasingly difficult for the Fed to engineer an elusive soft landing for the US economy.
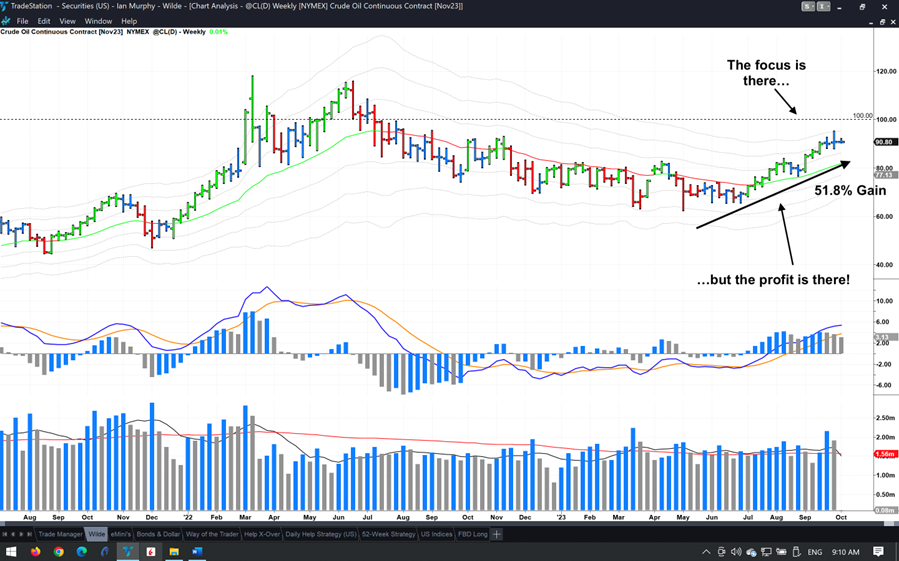
Another headwind that crept up silently on consumers over the late summer and early fall is the incessant rise in oil prices with the media fixated on the symbolic $100 level. As an active investor who tries to identify new market trends in their infancy, the 51.8% increase in crude prices since the week ending May 5 is significantly more important than a round number. If we can catch two or three of these multi-month moves with a significant chunk of our account, we will prosper as traders and active market investors over a year.
Trader’s Question
And that brings us neatly to this month’s timely question from Helen: “How do you handle a position in a stock that skyrockets upwards (e.g. NVDA)? I want to stay in for more profit but I’m always afraid it will crash, and I’ll lose what I’ve already gained.”
Helen is not alone in facing this dilemma as the recent pullback in stocks has placed a legion of traders in the same situation. If we are to progress in the markets, we need to come up with a plan to address this recurring challenge, and as always, the solution requires a choice between what appear to be less-than-perfect options.
However, before we get to the point where we need to make a choice, we need to get our heads around the fact that the pursuit of perfection in trading is the enemy of the very good. No matter how the trade unfolds we will feel we could have done better, especially if we are competitive by nature. A profitable trade is a very good trade, period! A consistently ‘good trader’ with a steadily rising (and sometimes flat) equity curve in their account is far superior to one with erratic gains and losses and the accompanying emotional rollercoaster.
We also need to understand the game we are playing and select the most appropriate strategy for our lifestyle and financial resources. Helen doesn’t mention it in her question, but if she is buying stocks to capture a long-term bullish move, she is using a ‘trend following’ style.
Trend following is a well-established style and is particularly suited to part-time traders and ‘mom-and-pop investors. At the heart of this style is the issue of whipsaw and lag. The former involves being stopped out and re-entering frequently, the latter gives a stock more room to breathe as it climbs higher. The difference between them essentially revolves around the location of our trailing protective stop. The trick is to understand what a typical bullish trend structure looks like, so we know to stay in if we have one or to get out if we don’t. Crucially we need to know the exact point where the trend has ended - where it has crossed the line.
I prefer a lag-dependent approach which gives more room for a stock to pullback, and in the case of Nvidia Corp (NVDA), I would use a weekly chart with a soft trailing stop on a closing basis on the -1ATR line (line in the sand). Whenever I’m asked about a stock this is the first chart I look at because we can see immediately what the current trend is.
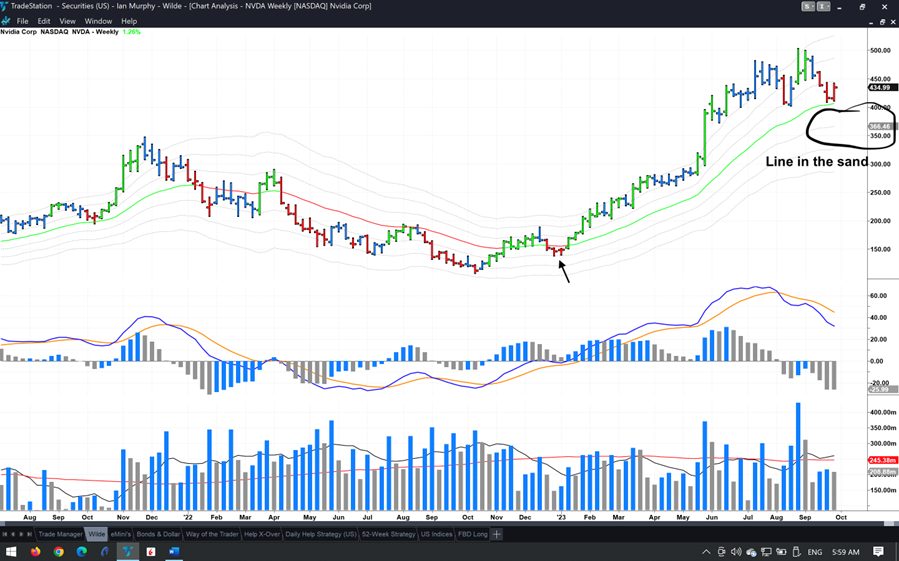
Let’s say we entered on the week ending January sixth when NVDA pulled back but found support on the aforementioned -1ATR line (arrow). This is a classic sign of a trend change from bearish (or neutral) to bullish and a great place to enter. Once in the stock, I would stay with it (the trend) until the price closed below the -1ATR (currently at $366.46) at the end of the week (Friday at 4:00 PM ET).
52-Week Strategy
The position in this strategy endured a bit of drama last Friday when it looked as if the trade might need to be closed for just the second time in nine months. Throughout the week the price bar on the 2x ProShares ETF (SSO) flirted with the exit point (-1ATR line as mentioned above) only to recover in Friday afternoon’s session to finish out the week just above the line.
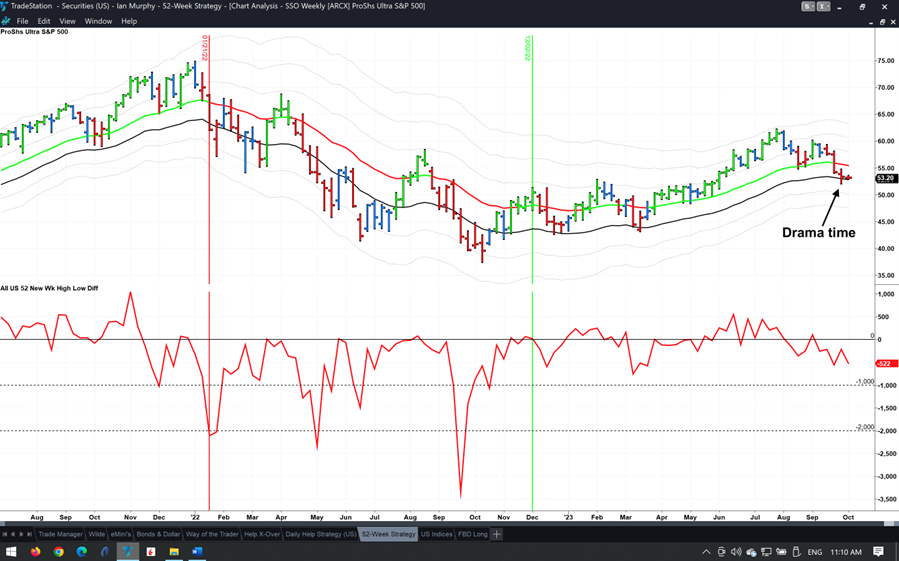
This week’s bar has already started on the back foot and is trading on top of the line. It looks as if another interesting week lies ahead. Currently (11 AM Monday) the soft stop is at $52.85.
Learn more about Ian Murphy at MurphyTrading.com.


