
For today’s trade of the day we will be looking at a Daily Price chart for Akamai Technologies, Inc. (AKAM), states Chuck Hughes of Hughes Optioneering.
Before breaking down AKAM’s daily price chart let’s first review which products and services are offered by the company.
Akamai Technologies, Inc. provides cloud services for securing, delivering, and computing content, applications, and software over the Internet in the United States and internationally. The company offers cloud solutions to keep infrastructure, websites, applications, application programming interfaces, and users safe from various cyberattacks and online threats while enhancing performance.
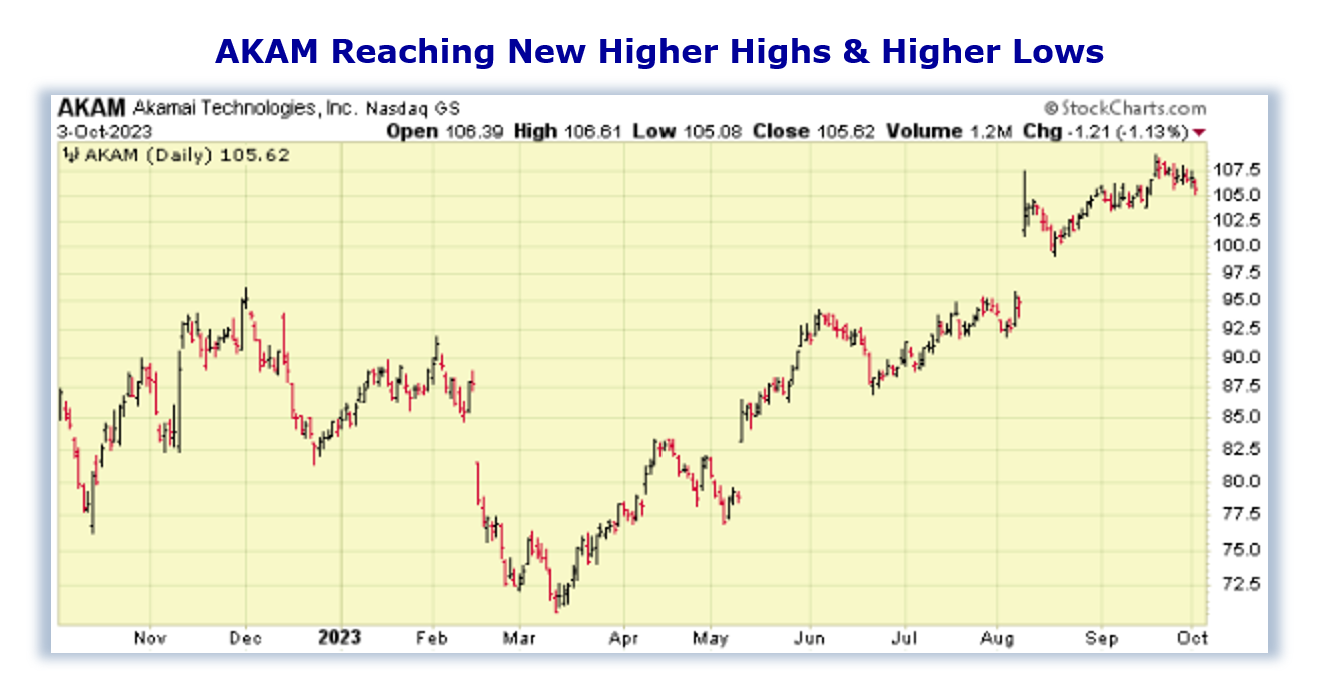
Now, let’s begin to break down the Daily Price chart for AKAM. Below is a Daily Price Chart with the price line displayed by an OHLC bar.
Buy AKAM Stock
The Daily Price chart above shows that AKAM stock began reaching a series of higher highs and higher lows since mid-August. This pattern of bullish trading suggests the stock will march on to a further advance. You see, after a stock makes a series of two or more higher highs and higher lows, the stock typically continues its price-up trend and should be purchased. Our initial price target for AKAM stock is 109.50 per share.
Profit if AKAM is Up, Down, or Flat
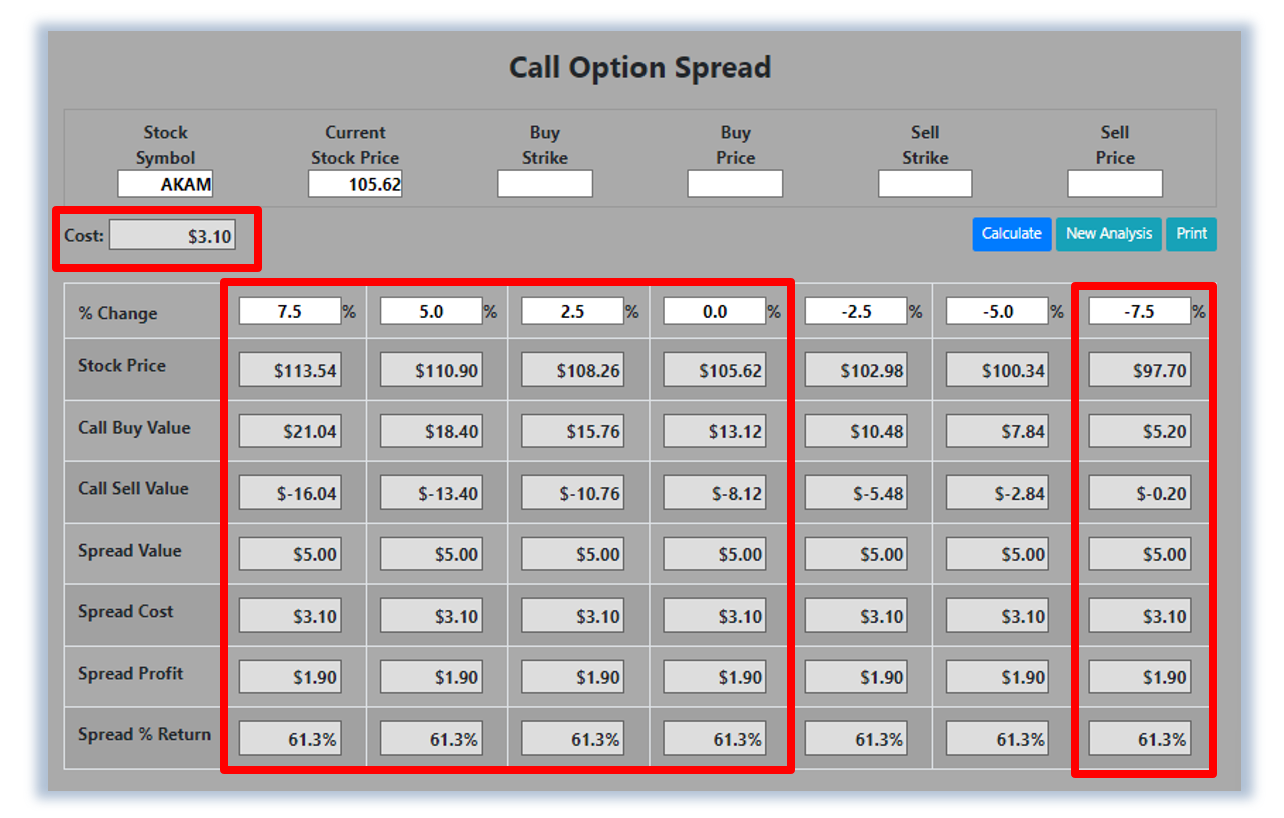
Now, since AKAM is currently making a series of higher highs and higher lows and will likely rally from here, let’s use the Hughes Optioneering calculator to look at the potential returns for an AKAM call option spread. The Call Option Spread Calculator will calculate the profit/loss potential for a call option spread based on the price change of the underlying stock/ETF at option expiration in this example from a 7.5% increase to a 7.5% decrease in AKAM stock at option expiration.
The goal of this example is to demonstrate the ‘built-in’ profit potential for option spreads and the ability of spreads to profit if the underlying stock is up, down, or flat at option expiration. Out of fairness to our paid option service subscribers we don’t list the option strike prices used in the profit/loss calculation. The prices and returns represented below were calculated based on the current stock and option pricing for AKAM on 10/3/2023 before commissions.
Built-in Profit Potential
For this option spread, the calculator analysis below reveals the cost of the spread is $310 (circled). The maximum risk for an option spread is the cost of the spread. The analysis reveals that if AKAM stock is flat or up at all at expiration the spread will realize a 61.3% return (circled). And if AKAM stock decreases 7.5% at option expiration, the option spread would make a 61.3% return (circled).
Due to option pricing characteristics, this option spread has a ‘built-in’ 61.3% profit potential when the trade was identified. Option spread trades can result in a higher percentage of winning trades compared to a directional option trade if you can profit when the underlying stock/ETF is up, down, or flat. A higher percentage of winning trades can give you the discipline needed to become a successful trader.
The Hughes Optioneering Team is here to help you identify profit opportunities just like this one.