
For today’s trade of the day we will be looking at a Daily Price chart for Vista Energy Corp. (VST), states Chuck Hughes of Hughes Optioneering.
Before breaking down VST’s daily price chart let’s first review which products and services are offered by the company.
Vistra Corp., together with its subsidiaries, operates as an integrated retail electricity and power generation company. The company operates through six segments: Retail, Texas, East, West, Sunset, and Asset Closure. It retails electricity and natural gas to residential, commercial, and industrial customers across 20 states in the United States and the District of Columbia.
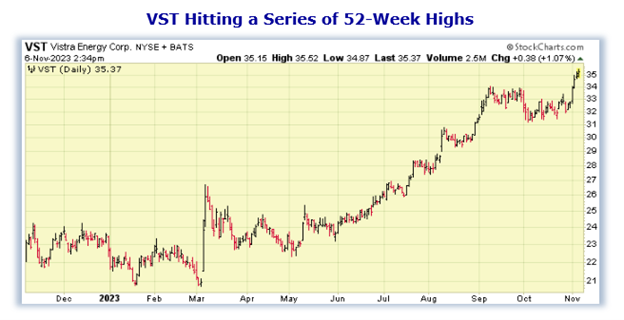
Now, let’s begin to break down the Daily Price chart for VST. Below is a Daily Price Chart with the price line displayed by an OHLC bar.
Buy VST Stock
The Daily Price chart above shows that VST stock has been hitting new 52-week Highs regularly over the past week. Simply put, a stock does not just continually hit a series of new 52-week Highs unless it is in a very strong bullish trend. The Hughes Optioneering team looks for stocks that are making a series of 52-Week Highs as this is a good indicator that the stock is in a powerful uptrend. You see, after a stock makes a series of two or more 52-week Highs, the stock typically continues its price uptrend and should be purchased. Our initial price target for VST stock is 36.50 per share.
91.9% Profit Potential for VST Option
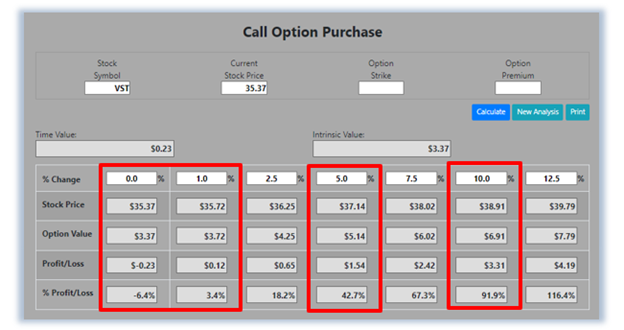
Now, since VST stock is currently making a series of 52-week Highs this means the stock’s bullish rally will likely continue. Let’s use the Hughes Optioneering calculator to look at the potential returns for a VST call option purchase. The Call Option Calculator will calculate the profit/loss potential for a call option trade based on the price change of the underlying stock/ETF at option expiration in this example from a flat VST price to a 12.5% increase.
The Optioneering Team uses the 1% Rule to select an option strike price with a higher percentage of winning trades. In the following VST option example, we used the 1% Rule to select the VST option strike price but out of fairness to our paid option service subscribers we don’t list the strike price used in the profit/loss calculation.
Trade with Higher Accuracy
When you use the 1% Rule to select a VST in-the-money option strike price, VST stock only has to increase 1% for the option to break even and start profiting! Remember, if you purchase an at-the-money or out-of-the-money call option and the underlying stock closes flat at option expiration it will result in a 100% loss for your option trade! In this example, if VST stock is flat at 35.37 at option expiration, it will only result in a 6.4% loss for the VST option compared to a 100% loss for an at-the-money or out-of-the-money call option.
Using the 1% Rule to select an option strike price can result in a higher percentage of winning trades compared to at-the-money or out-of-the-money call options. This higher accuracy can give you the discipline needed to become a successful options trader and can help avoid 100% losses when trading options.
The goal of this example is to demonstrate the powerful profit potential available from trading options compared to stocks. The prices and returns represented below were calculated based on the current stock and option pricing for VST on 11/6/2023 before commissions. When you purchase a call option, there is no limit on the profit potential of the call if the underlying stock continues to move up in price.
For this specific call option, the calculator analysis below reveals if VST stock increases 5.0% at option expiration to 37.14 (circled), the call option would make 42.7% before the commission. If VST stock increases 10.0% at option expiration to 38.91 (circled), the call option would make 91.9% before the commission and outperform the stock return by more than nine to one. The leverage provided by call options allows you to maximize potential returns on bullish stocks.