
For today’s trade of the day we will be looking at a monthly chart for Cyber-Ark Software Ltd. (CYBR), states Chuck Hughes of Hughes Optioneering.
Before breaking down CYBR’s monthly chart let’s first review what products and services the company offers. CyberArk Software Ltd., together with its subsidiaries, develops, markets, and sells software-based security solutions and services in the United States, Israel, Europe, the Middle East, Africa, the United Kingdom, and internationally. Its solutions include Privileged Access Manager which offers risk-based credential security and session management to protect against attacks involving privileged access.
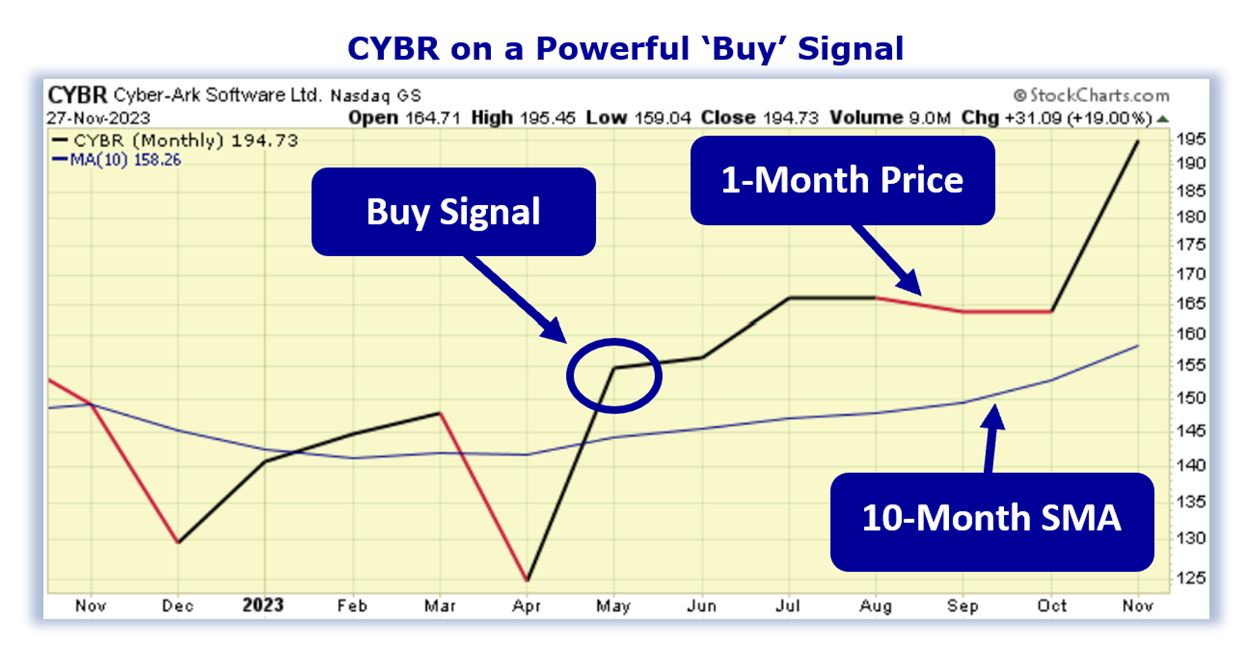
Now, let’s begin to break down the monthly chart for CYBR stock. Below is a ten-month Simple Moving Average chart for Cyber-Ark Software Ltd.
Buy CYBR Stock
As the chart shows, in May, the CYBR 1-Month Price, crossed above the 10-Month simple moving average (SMA). This crossover indicated the buying pressure for CYBR stock exceeded the selling pressure. For this kind of crossover to occur, a stock has to be in a strong bullish uptrend. Now, as you can see, the 1-month Price is still above the ten-month SMA. That means the bullish trend is still in play!
As long as the one-month price remains above the ten-month SMA, the stock is more likely to keep trading at new highs and should be purchased. Our initial price target for CYBR is 205.00 per share.
Profit if CYBR is Up, Down, or Flat
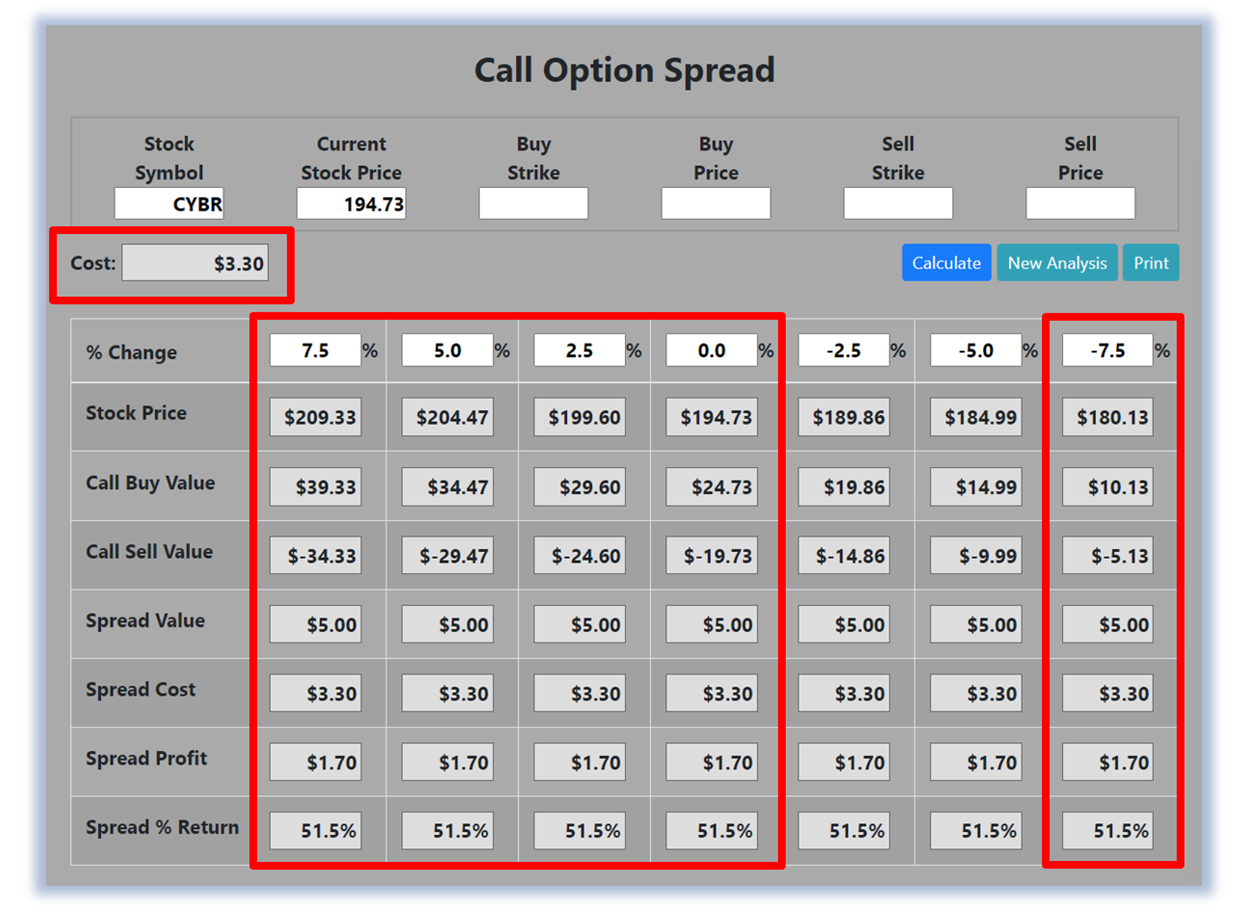
Now, since CYBR’s Monthly Price is currently trading above the Ten-Month SMA and will likely rally from here, let’s use the Hughes Optioneering calculator to look at the potential returns for a CYBR call option spread. The Call Option Spread Calculator will calculate the profit/loss potential for a call option spread based on the price change of the underlying stock/ETF at option expiration in this example from a 7.5% increase to a 7.5% decrease in CYBR stock at option expiration.
The goal of this example is to demonstrate the ‘built-in’ profit potential for option spreads and the ability of spreads to profit if the underlying stock is up, down, or flat at option expiration. Out of fairness to our paid option service subscribers we don’t list the option strike prices used in the profit/loss calculation. The prices and returns represented below were calculated based on the current stock and option pricing for CYBR on 11/27/2023 before commissions.
Built-in Profit Potential
For this option spread, the calculator analysis below reveals the cost of the spread is $330 (circled). The maximum risk for an option spread is the cost of the spread. The analysis reveals that if CYBR stock is flat or up at all at expiration the spread will realize a 51.5% return (circled). And if CYBR decreases 7.5% at option expiration, the option spread would make a 51.5% return (circled).
Due to option pricing characteristics, this option spread has a ‘built-in’ 51.5% profit potential when the trade was identified. Option spread trades can result in a higher percentage of winning trades compared to a directional option trade if you can profit when the underlying stock/ETF is up, down, or flat. A higher percentage of winning trades can give you the discipline needed to become a successful trader.