

This is going to be my last Reitmeister Total Return commentary of 2023 as I take next week off for the holidays. Thus, now is the best time to tackle my annual Lessons Learned issue, states Steve Reitmeister of Reitmeister Total Return.
Meaning if we don't honestly review the lessons of the past...we are likely doomed to repeat those same mistakes in the future. Not only is that foolish...but highly unprofitable. And that is the importance of doing this annual review.
Market Commentary
Let’s just do a quick version of our typical market commentary before tackling the Lessons Learned. The Fed has finally provided the “dovish tilt” and stocks are off to the races with the S&P 500 making post-bear market highs today at 4,768. We are now barely more than 1% away from the all-time high of 4,818 set back on January fourth, 2022.
Earlier GDP estimates were hovering around a very modest +1% for Q4. That has since popped up to +2.6% according to GDP Now. This furthers the narrative that the Fed has paved the way for a soft landing for the economy before they start lowering rates sometime in 2024 (current market predictions point to that happening at their March 2024 meeting).
Further, the market gains are broadening out to smaller stocks that were significant underperformers earlier in the year.
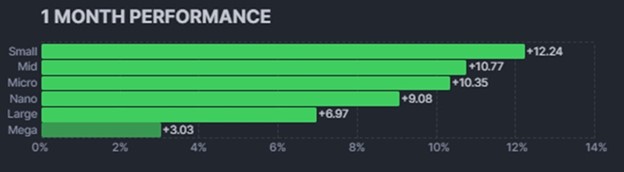
The above chart is a welcome inverse of what we saw earlier in 2023 when the mega caps were getting all the love while other groups were left far behind. I fully expect this rotation to smaller stocks to continue into 2024 and has been a big part of our recent outperformance for the Reitmeister Total Return portfolio.
Now let’s turn our attention to the...
2023 Lessons Learned
The most dangerous expression in all of investing is...
“This time is different”
That is rarely ever true because history typically repeats itself and that is the safest bet for investors That is why almost everyone and their mother predicted a recession forming with a deeper bear market to follow once inflation spiked and the Fed embarked on one of the most aggressive rate hiking regimes in history. When you consider that 12 of the last 15 times the Fed has raised the rate, we have entered a recession. On top of that the Fed typically has a positive bias in their outlook calling for a soft landing and yet still 75% of the time a recession unfolded.
Amazingly, this time around the Fed predicted a mild recession before their hawkish policies concluded. Add that to the historical track record and it only makes sense to bet on a recession and a bear market. Yet amazingly...this time is different. Let’s not forget that the yield curve is inverted. That’s when short-term rates become higher than long-term rates (typically comparing the two-year vs. ten-year Treasury). Here is the picture from March 2023.
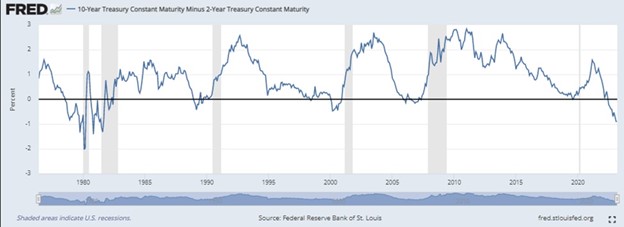
As you can see the track record of this inversion predicting a future recession (gray bars) is legendary. And yet here again...this time is different as no recession emerged. Of course, the key question now is...WHY was this time different? As it turns out the onset of Covid pushed two to four million American workers to choose early retirement instead of going back to work. This made the jobs market amazingly resilient as virtually any skilled person could find employment. Thus, no matter how hard the Fed stepped on the brakes of the economy with their rate hikes...they could not hurt the resilient employment market. And without job loss...there is no income loss...and thus no drop in spending.
That is how the economy broke with tradition and remained in growth mode. Gladly inflation was tamed in the process creating the pathway to a soft landing and resumption of the bull market. Those of us with a fundamental bias (like yours truly both blessed and cursed with an Economics degree) found it harder to appreciate this change that broke from historical norms. Gladly there is a counterbalance to fundamentals that I have come to appreciate more and more in my investment process. Of course, I am talking about price action. In particular, the benefit of monitoring the 200-day moving average for the S&P 500 which is the best indicator of the long-term trend.
When you boil it down, it is wise to be bullish above the 200-day for the S&P 500. And to be bearish under that mark. Here are the key excerpts: “Price action is a much more reliable means of market timing than fundamentals. In particular, a focus on the 200-day moving average (AKA the long-term trend line).
The merits of this technical signal are hard to admit for someone like myself with an economics background. But then I remembered some behavioral finance studies that Mohamed El-Erian discussed a few years back. The original theory was that investors predicted events four to six months in advance. That is why stocks typically dumped before bad economic events happened and seemed to rise during the darkest hour before the data improved.
Interestingly, some of the more recent research shows that it may not be that investors are so clairvoyant. Rather the positive or negative vibes from the stock price trends had a resounding effect on the economy. At first, this notion sounds crazy. But let’s remember that the vast majority of wealth in this country is in the hands of the top 10% who own 90% of the assets. No doubt a lot of that money is in the stock market.
Now consider that these same folks are the captains of industry. So, when their portfolios take a hit...they see their net worth go down...which leads to more cautious personal and business spending...which slows the economy. Here we can see how price action precedes economic activity. On the flip side, we have a soaring stock market amid a weak economic outlook. The net worth of these same wealthy people is on the rise...which lifts their mood. As they become less cautious and more optimistic, they start to spend more...thus improving economic conditions...thus showing the wisdom of the rising stock prices.
Long story short, price action is another valuable leading economic indicator. This only increases the value of using the 200-day moving average as a key lever in when to be cautious (under 200 days) or more aggressive with stocks (over 200 days).” Heeding the merits of the improved price action this year allowed my Reitmeister Total Return portfolio to become bullish sooner than many of my fundamentally inclined peers.
Yes, in hindsight it would have been great to heed these signals even sooner. But as they say, no one rings a bell at the bottom. All in all, appreciating the lessons learned from the past, the inclusion of price action as a failsafe overriding the fundamental outlook improved my results this year. The main takeaway going forward is to react even sooner to those signals the next time around.
Learn More About Reitmeister Total Return here…


