

Few could’ve imagined the rally we’re witnessing right now. As Mark Twain famously said, “It’s easier to fool people than to convince them they have been fooled.” Accepting a doomsday narrative was commonplace everywhere you turned, states Lucas Downey of Mapsignals.com.
However, at MAPsignals we saw brighter days through our evidence-based lens. And that lens still signals a bold forecast: Double-digit gains are coming in 2024. It isn’t often we see the S&P 500 surge 16.15% in 36 trading days. That said, it’s important to note the depths saw just weeks earlier. As a reminder, small caps saw valuations in the bottom bucket of history and our Big Money Index (BMI) dropped to the shallowest readings since the pandemic crash.
As seen time and time again, when the pendulum swings violently to one side, it often powerfully corrects in the opposite direction…fooling the critics. I believe the latest thrust higher in equities is partly due to the severity of the September–October selloff. As they say, the bigger the dip, the bigger the rip. While there’s no doubt that the rate of momentum seen recently will surely not last at this breakneck pace, historical evidence paints a very green picture for next year. Today we’ll view a few charts revealing how powerful this latest up-move is. Then we’ll study what possibly lies ahead.
It’s A December to Remember
Records were broken recently. The level of participation for stocks reached the highest ever. This has sent our trusty Big Money Index (BMI) to heights last seen since the pandemic. As a reminder, the BMI is a moving average of institutional buying relative to selling. When the yellow line springs higher, sellers dry up as buyers surge. The latest 88% level rarely gets breached:
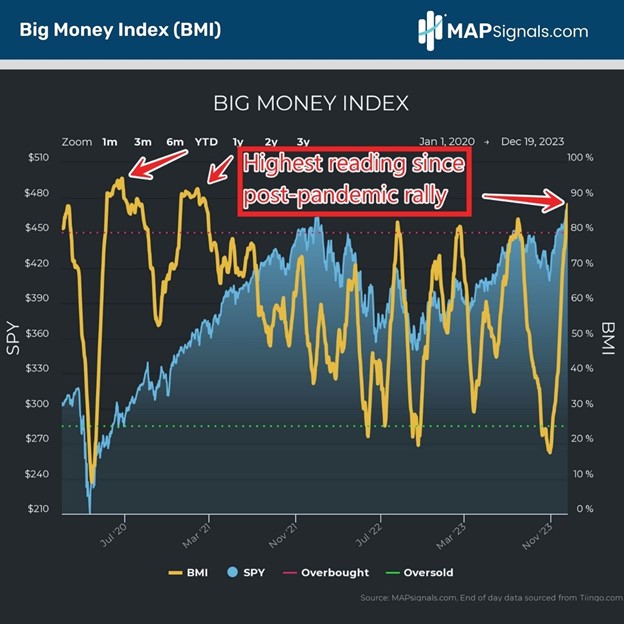
Only the most powerful inflows can send the BMI to levels this extreme. Diving below the surface reveals exactly why this indicator is popping off the charts. Thursday, December 14, marked the largest inflow day ever recorded in our data. A mind-blowing 650 stocks were accumulated that day. This towers above the largest day seen before this event back on June 5, 2020, when 597 equities were scooped:
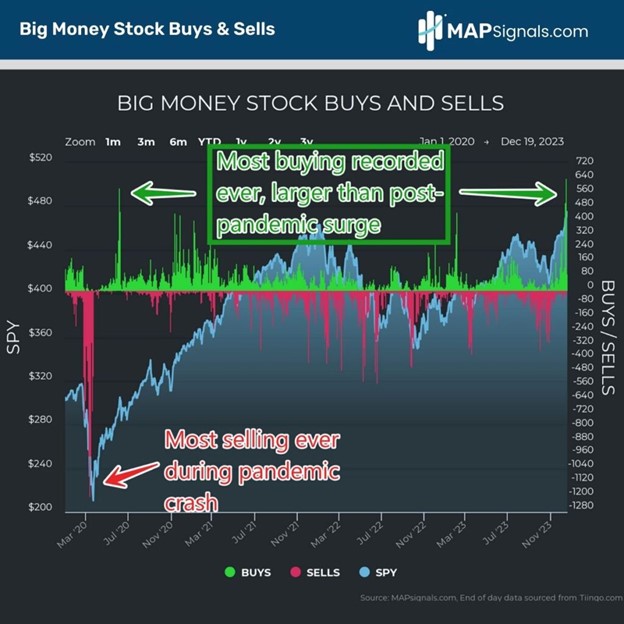
When 40% of our equity universe logs green signals, all sectors participate…especially beaten-down small-caps, Financials, REITs, and Discretionary names. These blowoff tops are common after equity wipeouts. Beginning in late October, our BMI bottomed and began a relentless march higher. We couldn’t have pounded the bullish drums louder back then. There’ve been plenty of oversold markets in the past to learn from. We’ve seen this crowd-stunning bullish movie time and time again. Don’t be fooled, stocks always surge out of oversold conditions.
This time is no different, except for one major aspect. Once the Fed pivot was telegraphed, the already heated market was sent into overdrive. With the Fed now set to cut interest rates, the macro-outlook now provides a powerful tailwind…one that suggests double-digit gains are coming in 2024. Even a Grinch will crack a smile…
Double-Digit Gains are Coming in 2024
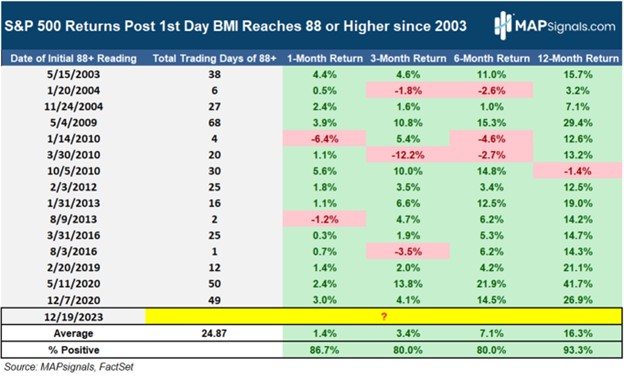
Normally, reaching overbought conditions is a time to get near-term bearish. The red zone is defined as 80%+ for the BMI. But, in some very rare instances, readings of 88% and higher do occur, like in today’s environment. I went back and studied every day when the BMI clocked 88% or better. The findings are stunning.
Since 2003, there’ve been 15 periods where this condition is met. Interestingly, once we break into this ultra-high area, we tend to hang there for an average of 25 trading days. So, we should prepare for this fat rally to persist for some time. Even more impressive are the returns for the S&P 500 from the first day we pierce 88%. It’s one of the strongest bullish omens you’ll find. A month later stocks gained +1.4%. Three months later equities jumped +3.4%. Be bold for 12 months and it’s a mega-performance averaging +16.3% returns:
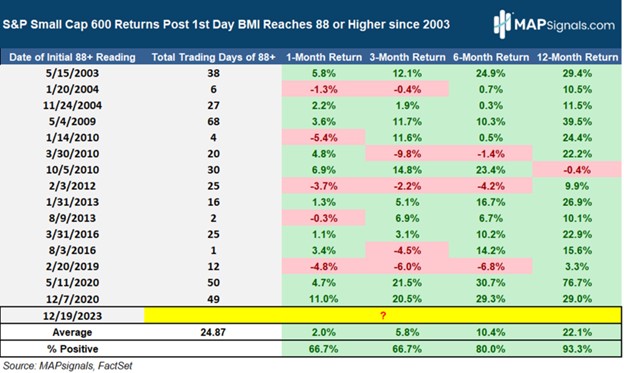
And the fun doesn’t stop here. This setup is kinder to small-caps than large-caps. Using the same framework, the S&P Small Cap 600 crushes these numbers by a mile.
- Three months later small-caps rip +5.8%
- Six months after they climb +10.4%
- 12-months post this signal hands you an average gain of +22.1%
What this study suggests is we are entering a period favoring heavy equity appreciation. This is worth ringing the Christmas bells…but hold for a moment. There’s more to be excited about. The next study will drop the hammer on why double-digit gains are coming in 2024. There are plenty of ways to slice data. The recent stock surge created some of the highest readings of buying relative to selling ever.
Let me explain. The Big Money Index is a simple 25-day moving average of buy ratio days. As an example, days where 90 stocks are bought and ten stocks are sold, give us a 90% buy day. That same 90% ratio can occur with 450 stocks bought and 50 stocks sold. But we know the latter has a much higher participation rate. To give more weight to higher breadth readings, I normalized the recent buying relative to selling rather than just using a simple daily moving average.
Doing this exercise shows that 3986 stocks were accumulated in the last five weeks while only 362 stocks were sold. Contrast that to the last time we went overbought when 2490 stocks were bought and 468 stocks were sold. 60% more participation this go-round is significant as 3986 names accumulated is magnitudes greater than 2490 by a longshot. Normalizing this level of relative buying reveals a 91.6% breadth rate.
Folks, this is uber-rare to see. Don’t be fooled by pundits proclaiming this rally doesn’t have legs. Back in 2012, I captured all instances above an 89% participation rate to give us a good idea of similar thrusts. It’s only occurred seven times. Incredibly, the S&P 500 has never been lower three to 12 months out:
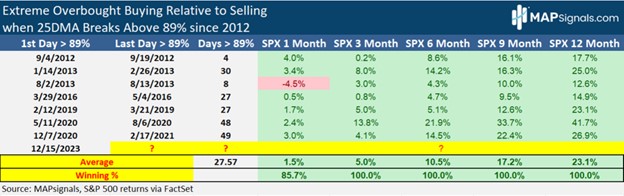
12 months after this ultra-rare signal, stocks are up 23.1% on average. Couple that with a dozen charts pointing to big gains next year…and I think it’s foolish not to expect a big surge. Now feel free to jingle those Christmas bells. Let’s wrap up.
Here’s the Bottom Line: Record stock buying is sending our indicators heavily into overbought territory. A Big Money Index (BMI) reading of 88% is ultra rare. Don’t be fooled. Levels of 88% or higher forecast double-digit gains for large- and small-caps 12 months later. Even better is the fact that the intensity of the inflows is significant. Since 2012, similar breadth readings have occurred seven times and produced double-digit gains six to 12 months later…with a 100% win rate! These are the types of face-ripper environments we’ve been hinting at for months. The highest quality stocks are back in the driver’s seat.
To learn more about Lucas Downey, visit Mapsignals.com.


