
For today’s Trade of the Day we will be looking at a Daily Price chart for Amgen, Inc. (AMGN), states Chuck Hughes of Hughes Optioneering.
Before breaking down AMGN’s daily price chart let’s first review which products and services are offered by the company. Amgen Inc. discovers, develops, manufactures, and delivers human therapeutics worldwide. It focuses on inflammation, oncology/hematology, bone health, cardiovascular disease, nephrology, and neuroscience areas. The company’s products include Enbrel to treat plaque psoriasis, rheumatoid arthritis, and psoriatic arthritis; Neulasta which reduces the chance of infection due to a low white blood cell count in patients with cancer; among others.
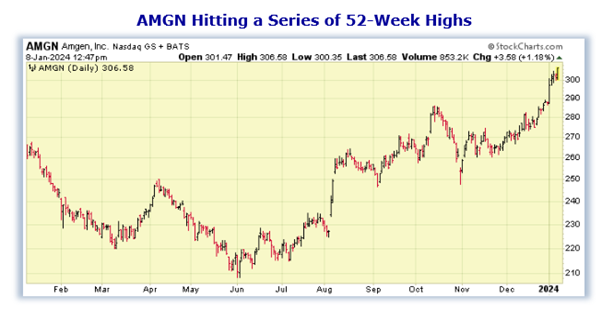
Now, let’s begin to break down the Daily Price chart for AMGN. Below is a Daily Price Chart with the price line displayed by an OHLC bar.
Buy AMGN Stock
The Daily Price chart above shows that AMGN stock has been hitting new 52-week Highs regularly since early January. Simply put, a stock does not just continually hit a series of new 52-week Highs unless it is in a very strong bullish trend. The Hughes Optioneering team looks for stocks that are making a series of 52-Week Highs as this is a good indicator that the stock is in a powerful uptrend.
You see, after a stock makes a series of two or more 52-week Highs, the stock typically continues its price uptrend and should be purchased. Our initial price target for AMGN stock is 315.00 per share.
Profit if AMGN is Up, Down, or Flat
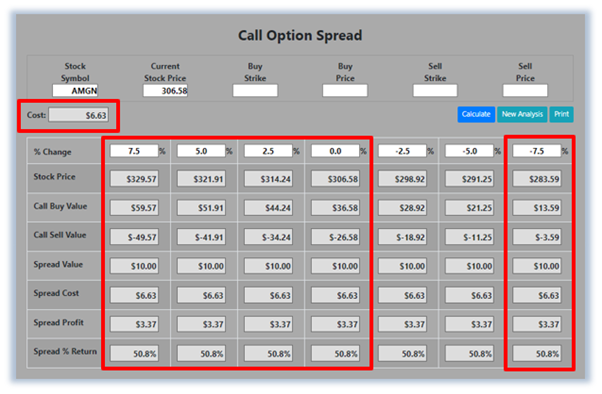
Now, since AMGN is making a series of new 52-week Highs and will likely rally from here, let’s use the Hughes Optioneering calculator to look at the potential returns for an AMGN call option spread. The Call Option Spread Calculator will calculate the profit/loss potential for a call option spread based on the price change of the underlying stock/ETF at option expiration in this example from a 7.5% increase to a 7.5% decrease in AMGN stock at option expiration.
The goal of this example is to demonstrate the ‘built-in’ profit potential for option spreads and the ability of spreads to profit if the underlying stock is up, down, or flat at option expiration. Out of fairness to our paid option service subscribers we don’t list the option strike prices used in the profit/loss calculation. The prices and returns represented below were calculated based on the current stock and option pricing for AMGN on 1/8/2024 before commissions.
Built-in Profit Potential
For this option spread, the calculator analysis below reveals the cost of the spread is $663 (circled). The maximum risk for an option spread is the cost of the spread. The analysis reveals that if AMGN stock is flat or up at all at expiration the spread will realize a 50.8% return (circled). And if AMGN stock decreases 7.5% at option expiration, the option spread would make a 50.8% return (circled).
Due to option pricing characteristics, this option spread has a ‘built-in’ 50.8% profit potential when the trade was identified. Option spread trades can result in a higher percentage of winning trades compared to a directional option trade if you can profit when the underlying stock/ETF is up, down, or flat. A higher percentage of winning trades can give you the discipline needed to become a successful trader.