

The chart of the day belongs to the medical distribution company Cencora (COR), states Jim Van Meerten of BarChart.com.
I found the stock by using Barchart's powerful screening functions to find stocks with the highest technical buy signals, highest Weighted Alpha, superior current momentum, and a Trend Seeker buy signal. I then used the Flipchart feature to review the charts for consistent price appreciation. Since the Trend Seeker signaled a buy on 12/ 22 the stock gained 7.88%.
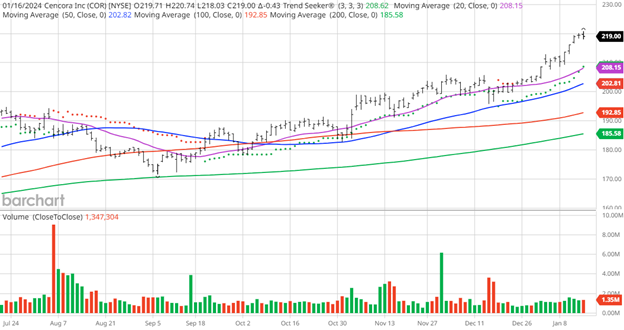
COR Price vs Daily Moving Averages
Cencora, Inc. sources and distributes pharmaceutical products. The company's U.S. Healthcare Solutions segment distributes pharmaceuticals, over-the-counter healthcare products, home healthcare supplies and equipment, and related services to acute care hospitals and health systems, independent and chain retail pharmacies, mail order pharmacies, medical clinics, long-term care and alternate site pharmacies, and other customers; provides pharmacy management, staffing, and other consulting services; supply management software to retail and institutional healthcare providers; packaging solutions to various institutional and retail healthcare providers; clinical trial support, product post-approval, and commercialization support services; data analytics, outcomes research, and additional services for biotechnology and pharmaceutical manufacturers; pharmaceuticals, vaccines, parasiticides, diagnostics, micro feed ingredients, and other products to the companion animal and production animal markets; and sales force services to manufacturers.
Barchart's Opinion Trading systems are listed below. Please note that the Barchart Opinion indicators are updated live during the session every 20 minutes and can therefore change during the day as the market fluctuates. The indicator numbers shown below therefore may not match what you see live on the Barchart.com website when you read this report.
Barchart Technical Indicators:
- 100% technical buy signals
- 39.46+ Weighted Alpha
- 33.33% gain in the last year
- Trend Seeker buy signal
- Above its 20, 50, and 100-day moving averages
- 14 new highs and up 9.34% in the last month
- Relative Strength Index 78.68%
- Technical support level at $218.44
- Recently traded at $219.00 with a 50-day moving average of $202.82
Fundamental Factors:
- Market Cap $44 billion
- P/E 18.26
- Dividend yield .90%
- Wall Street projects Revenue will grow 8.30% this year and another 6.10% next year
- Earnings are estimated to increase by 7.70% this year, an additional 8.80% next year then continue to compound at an annual rate of 8.70% for the next five years
Analysts and Investor Sentiment: I don't buy stocks because everyone else is buying but I do realize that if major firms and investors are dumping a stock it's hard to make money swimming against the tide:
- Wall Street analysts issued eight strong buy, two buy, five hold, and one under perform recommendations on the stock
- Analysts' price targets are $192 to $242 with a consensus of $213—that's below today's price so why so many strong buys and buys?
- The individual investors following the stock on Motley Fool voted 309 to 34 for the stock to beat the market with the most experienced investors voting 61 to five for the same result
- Value Line gives the stock its above-average rating of two with a three to five-year price target of $200 to $270
- CFRAs MarketScope has a four-star buy rating but a 12-month price target of $222—not far above today's price
- 22,420 investors monitor the stock on Seeking Alpha
Additional disclosure: The Barchart Chart of the Day highlights stocks that are experiencing exceptional current price appreciation. They are not intended to be buy recommendations as these stocks are extremely volatile and speculative. Should you decide to add one of these stocks to your investment portfolio it is highly suggested you follow a predetermined diversification and moving stop loss discipline that is consistent with your personal investment risk tolerance and reevaluate your stop losses at least every week.
On the date of publication, Jim Van Meerten did not have (either directly or indirectly) positions in any of the securities mentioned in this article. All information and data in this article is solely for informational purposes. For more information please view the Barchart Disclosure Policy here.


