

News-of-the-day analysis rarely offers value, states Lucas Downey of Mapsignals.com.
An ability to look forward is mission-critical for investing. As we prepare for a healthy pullback in the weeks ahead, here’s your falling Big Money Index playbook. Here’s an interesting fact. Stare into a mirror and your reflection will appear as double the distance. Standing five feet away from the looking glass will reflect an image with a virtual distance of ten feet.
We all know the actual distance is five feet, yet our brains recreate the distant image by looking through the metal. This looking-through concept is essential when it comes to the stock market. Investors with the ability to think forward, envisioning tomorrow’s situation—that’s powerful. Every great investor I’ve ever met had this skill…focusing out in the distance rather than being influenced by the prevailing media narrative. Lucky for us, our unique research lens has a data-driven forecasting ability. And right now, the yellow light is flashing, signaling a near-term pullback is expected. Money flows are shifting. One powerful historical study offers guidance on how to prepare in the weeks and months ahead.
Falling Big Money Index Playbook
Let’s rewind the tape a bit. Just two short weeks ago, we made the case to buy the dip in the first quarter. Historical evidence pointed to seasonal weakness early on in election years. Not only that, we were in the midst of a red-hot overbought market. Our angle then was to prepare for an impending pullback and use it as an opportunity to buy stocks on sale. Fast forward to today and a picture is emerging. Our data signals a changing tide with the Big Money Index (BMI) now coming under pressure. Below you’ll see shaded in white off to the right what I mean. The last two days shaved three percentage points off the BMI as selling increased:
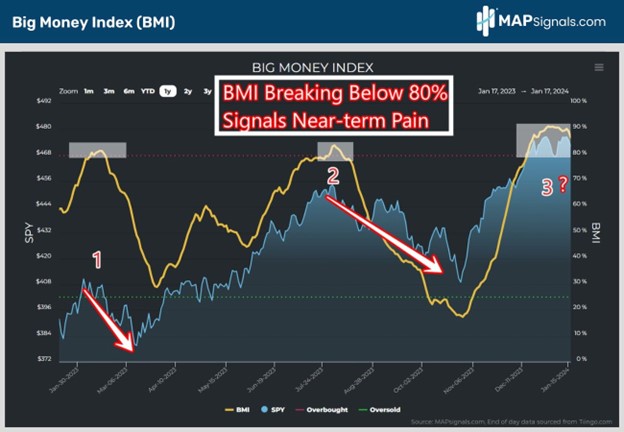
It’s not a matter of IF this indicator will fall in the future, but WHEN. Noted above are 2 prior overbought periods, prefacing a near-term market peak. If our base case is that equities will struggle a bit in the first quarter, we now need to look through the market metal to envision what’s ahead. To create a forward-looking framework, I asked one simple question: What happens to stocks once the Big Money Index falls out of overbought territory? When studying history, we must look backward to see what potentially lies ahead.
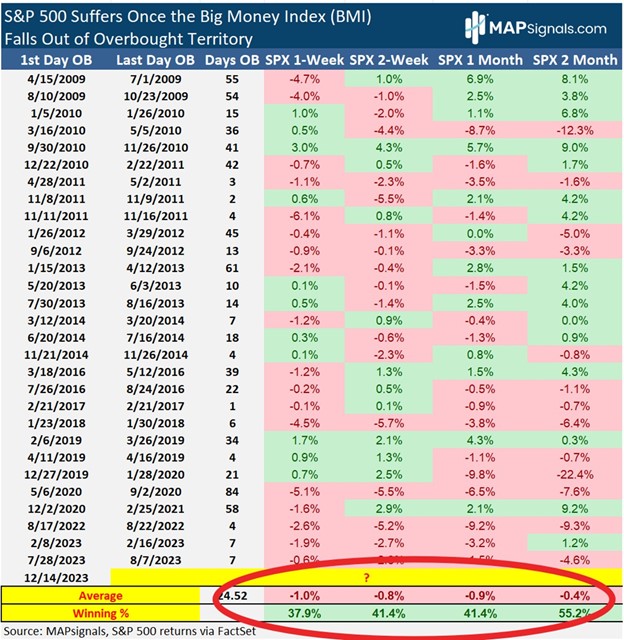
Since 2009, there’ve been 29 discrete instances when the BMI fell out of overbought territory. The forward returns for the S&P 500 are lackluster, to say the least:
- One week later markets fell 1%
- Two weeks later they’re down .8%
- One- and two months later stocks are still negative
Possibly even more striking is the low winning percentage. Only out to two months do we get better than coin-flip odds that stocks will gain:
While this may appear as a lot of jumbled numbers, I’ll make the visual even more impactful. This bumpy period for markets stands in stark contrast to normal market behavior. Let me explain that a bit. I went back and culled all one-week, two-week, one-month, and two-month average returns for the S&P 500 during the same nearly 15-year period. In general, markets have an upward positive trend of performance, which makes intuitive sense. When you map the normal expected S&P 500 returns vs. periods of a falling BMI the pullback narrative comes into focus. The real pain tends to come swiftly during the first week post the BMI plunge:
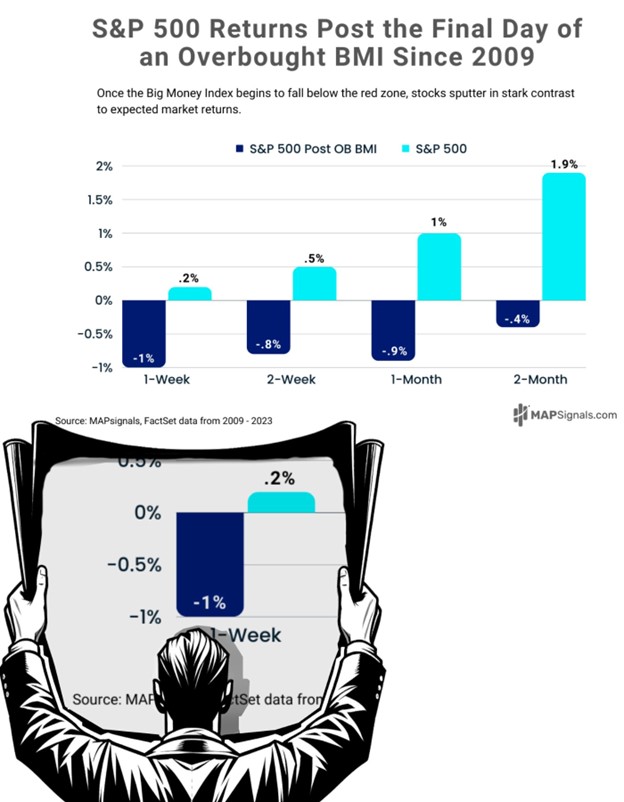
The Big Money-looking glass is offering us a forward outlook. Markets are no match once the tide goes out of stocks. If there is a simple takeaway for the falling Big Money Index playbook, it’s this: Start building an all-star shopping list because the pullback likely comes fast. The next few weeks and months will offer a solid buy-the-dip opportunity. The BMI often leads the market, falling well before the major indexes. Looking into the Big Money mirror today reveals what’s coming tomorrow. Don’t wait for confirmation…follow the money.
Here’s the Bottom Line: Today's analysis isn’t useful. Looking through the media narrative will put you in the driver’s seat. The Big Money Index (BMI) is finally starting to sink, signaling increased selling under the surface. Looking back, when the BMI falls out of overbought, the market’s struggle mightily one to two weeks later. Those planning ahead now will be in a prime position to take advantage of lower prices. It’s coming.
To learn more about Lucas Downey, visit Mapsignals.com.


