

The advance continued, with nine of the eleven S&P SPDR sectors higher last week. Consumer Discretionary (XLY) and Communication Services (XLC) were the best sectors, while Real Estate (XLRE) and Energy (XLE) were the weakest. The SPDR S&P 500 ETF Trust (SPY) was up +1.42%, notes Bonnie Gortler of bonniegortler.com.
S&P SPDR Sector ETFs Performance Summary 1/29/24-2/2/24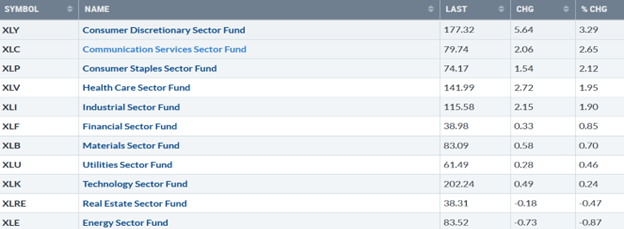
Source: Stockcharts.com
Figure 2: Bonnie’s ETFs Watch List Performance Summary 1/29/24-2/2/24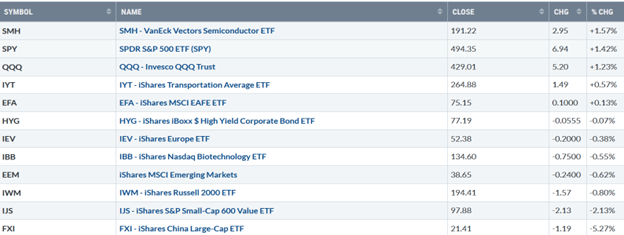
Source: Stockcharts.com
Semiconductors and Technology remained strong despite additional volatility. International markets remain weaker than the U.S., with continued pressure on China and Small-Cap Growth and Value.
Figure 3: UST 10YR Bond Yields Daily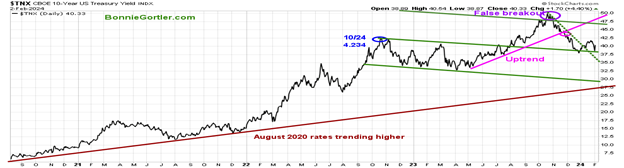
Source: Stockcharts.com
The 10-year U.S. Treasury fell last week but rose sharply on Friday after a low of 3.87%, closing at 4.033, holding above the middle channel after breaking the downtrend line (green dotted) from October. Rising yields could lead to downside pressure in equities. The major market averages continued to move higher. The Dow closed at an all-time high up +1.43%, the S&P 500 +1.38%, closing at an all-time high for the third consecutive week, while the Nasdaq gained +1.12%. The Russell 2000 Index continues to lag, down -0.79%.
Figure 4: Fear & Greed Index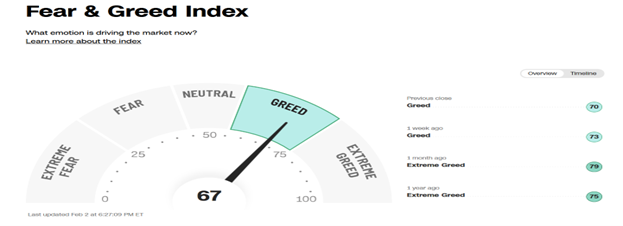
Source. CNN.com
Investor sentiment based on the Fear and Greed Index (a contrarian index) measures the market’s mood. The Fear and Greed Index closed at 67, falling from 73 last week but still showing greed.
Figure 5: Value Line Arithmetic Average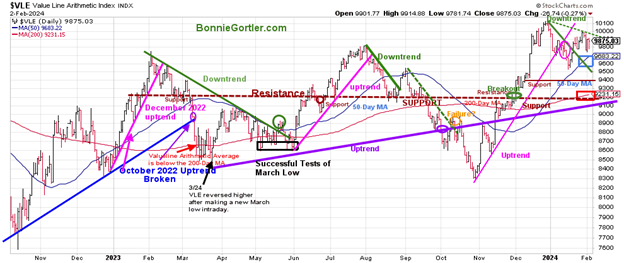
Source: Stockcharts.com
The Value Line Arithmetic Index ($VLE) is a mix of approximately 1700 stocks. VLE broke the October 2022 uptrend in early March 2023 (blue line on the left), and in April, May, and June successfully tested the March low, ultimately making a new low in October 2023. VLE did not participate in the rally, falling -0.11%, closing at 9875.03, and remaining above the rising 50-day MA (blue rectangle) and the 200-day MA (red rectangle), a sign of underlying strength. Support remains at 9600, 9400, and 9200. Resistance is at 10000 and 10200. It will be short-term positive if VLE holds above last week's low of 9742.82 and breaks the 2024 short-term downtrend (green dotted line on the right.) However, selling pressure will likely increase if VLE breaks below 9600.
Market Breadth is concerning, not confirming the new highs in the averages. Weekly market breadth was negative on the New York Stock Exchange Index (NYSE) and the Nasdaq. The NYSE had 1424 advances and 1508 declines, with 431 new highs and 80 new lows. There were 2014 advances and 2671 declines on the Nasdaq, with 469 new highs and 319 new lows.
Figure 6: Daily New York Stock Exchange (NYSE) New Lows 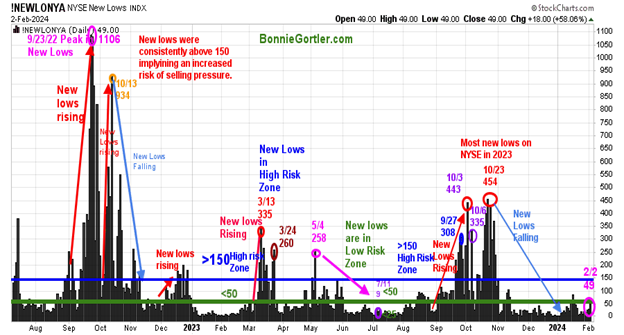
Source: Stockcharts.com
Watching New Lows on the New York Stock Exchange is a simple technical tool that helps awareness of the immediate trend's direction. New lows warned of a potential sharp pullback, high volatility, and "panic selling" for most of 2022, closing above 150. The peak reading of New Lows in 2022 was on 9/23 at 1106, not exceeded in 2023. New lows had stopped accelerating in early October 2023. However, the decline was not complete until the end of the month as New Lows made only a slight new high, peaking at 454 (red circle) on 10/23/23. Last week, New lows on the NYSE inched higher, closing at 49 (pink circle), no longer in the lowest-risk zone. It would remain positive and imply low risk if New Lows remain less than 50. On the other hand, an increase above 150 would be a warning sign of a market correction. Learn more about the significance of New Lows in my book, Journey to Wealth, published on Amazon.
Figure 7: Daily iShares Russell 2000 (IWM) Price (Top) and 12-26-9 MACD (Middle and Money Flow (Bottom)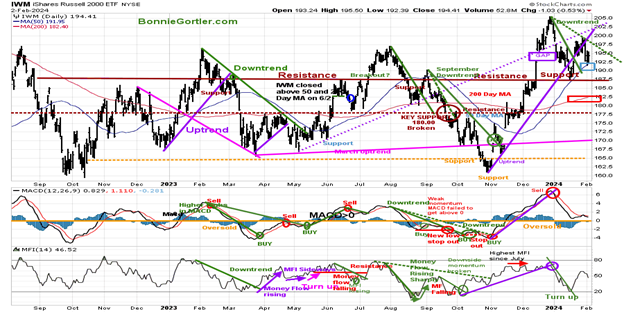
Source: Stockcharts.com
The top chart is the daily iShares Russell 2000 Index ETF (IWM), the benchmark for small-cap stocks, with a 50-Day Moving Average (MA) (blue line) and 200-Day Moving Average (MA) (red line) that traders watch and use to define trends. (IWM closed above both). IWM did not join the party, closing at 194.41, down -0.80% last week, remaining above the 50-day MA and the 200-day MA (blue rectangle. A close below both MAs would be short-term negative. Support is at 187.50, 182.50, and 177.50. Resistance is at 197.50, 202.50, and 205.00.
MACD (middle chart) remains on a sell, above 0, falling, but not yet oversold after reaching the highest momentum reading in December 2023. Money Flow (lower chart) turned up in January enough to break October's downtrend (green line), but MFI is now falling and considered short-term negative. It’s disturbing there was no follow-through above resistance at 197.50. Time will tell if IWM reverses above the downtrend from 2024 (green dotted line) and begins to outperform the S&P 500 or if there is more selling pressure if support breaks at 187.50.
Figure 8: Daily Semiconductors (SMH) (Top) and 12-26-9 MACD (Middle) and Money Flow (Bottom)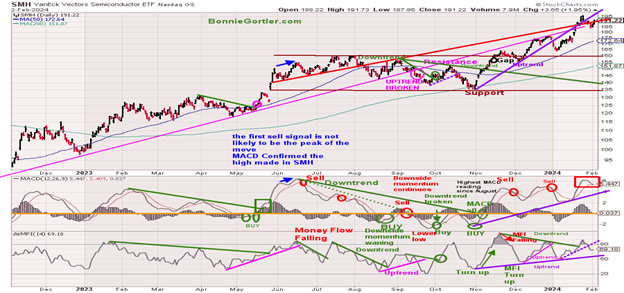
Source: Stockcharts.com
The top chart shows the Daily Semiconductors (SMH) ETF, concentrated mainly in US-based Mega-Cap Semiconductors companies. SMH tends to be a lead indicator for the market when investors are willing to take on increased risk and the opposite when the market is falling. The Semiconductor ETF (SMH) had increased volatility last week, remaining one of the strongest sectors, closing near its highs up +1.57%. Support is at 180.00, 175.00, and 160.00.
MACD (middle chart) remains on a sell, although SMH is higher since the sell. MACD is within striking distance of generating a repeat sell, falling from above 0. A break of the uptrend (purple line) would be a warning risk is increasing of a pullback toward support at 180.00. Money Flow (lower chart) broke below the uptrend (purple dotted line) but is holding above the uptrend from November. A break below would be bearish. As long as SMH shows strength, the bulls remain in control despite the momentum and money flow weakness. If weakness occurs, look for the profit-taking to begin and for bears to come out of hiding.
Figure 9: Daily Invesco QQQ Trust (QQQ) Price (Top) and 12-26-9 MACD (Bottom) 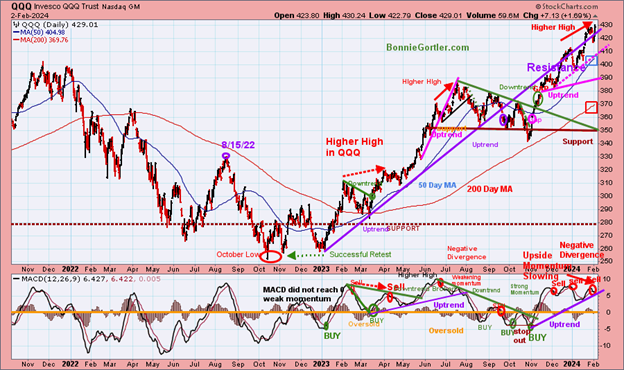
Source: Stockcharts.com
The chart shows the daily Invesco QQQ (QQQ), an exchange-traded fund based on the Nasdaq 100 Index. QQQ made a low in October 2022 (red circle), followed by a successful retest of the low in early January 2023 and the start of an uptrend. Last week, Nasdaq 100 closed at 429.01, at an all-time high up +1.03%, remaining above the rising 50-day Moving Average (blue rectangle) and the 200-day Moving Average (red rectangle), a sign of underlying strength.
Support is at 416.00, 408.00, 390.00, 370.00, and 350.00. Two closes below 416.00 will likely lead to short-term selling pressure. The bottom chart, MACD (12, 26, 9), remains on a sell, above 0, overbought, and falling. Notice the negative divergence in MACD, which does not confirm the QQQ new high. The uptrend from November 2023 remains in effect, but if there is a weakness in QQQ, the uptrend will break. The risk is rising that a pullback is possible at any time.
Figure 10: Nasdaq Advance Decline Line Daily (Top) and Nasdaq (Bottom)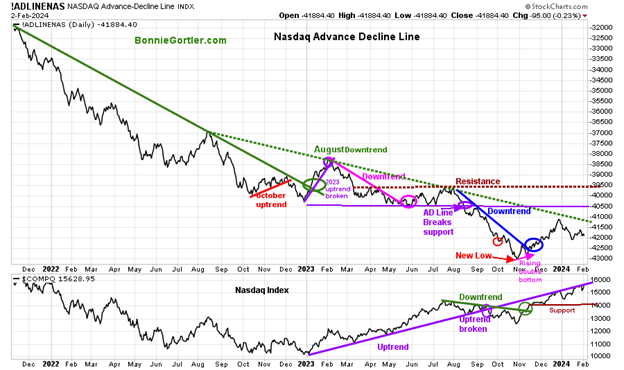
Source: Stockcharts.com
The top chart is the Nasdaq Daily Advance-Decline Line, a technical indicator that plots the difference between the number of advancing and declining stocks. In January 2023, the October 2022 downtrend was broken (solid green line) but quickly reversed lower in February 2023, when most of the stock participation was predominantly the large Mega Cap stocks. The AD-Line broke support (purple circle) in August 2023 and continued making new lows in October. Market breadth improved in November and December 2023 as the rally broadened. Since the end of 2023, market breadth has weakened, failing to break the AD-Line downtrend from August 2022 (green dotted line), which does not bode well for the market. Mega-cap tech stocks continue to lead the Nasdaq Composite (lower chart) higher. The Nasdaq support is 15000, followed by 14000. For the Nasdaq advance to be sustainable, more stocks need to participate in the rally. If you want to go more in-depth with charts, I invite you to join my Free Facebook group, Wealth Through Market Charts.
Figure 11: The S&P 500 Index (SPY) Daily (Top) and 12-26-9 MACD (Bottom)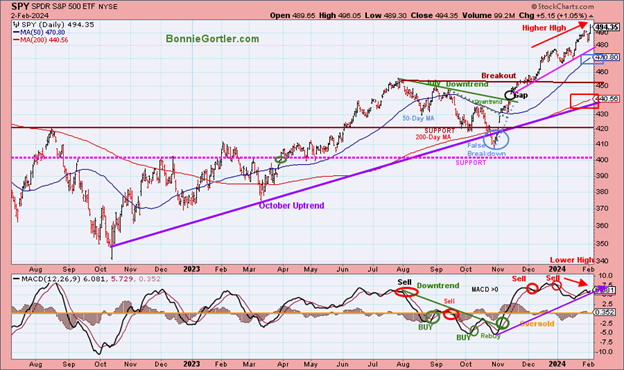
Source: Stockcharts.com
The S&P 500 (SPY) had a false breakdown (blue circle) in October after being in an uptrend (purple line). Two downtrends were in effect and broken to the upside in September (green dotted line) and August (green solid line). The daily trend for the SPY remains up. The upside objective of 485.00 was hit. The next upside objective is 510.00. The SPY closed at 494.35, up +1.42% for the week, remaining above the rising 50-day Moving Average (blue rectangle) and the 200-day Moving Average (red rectangle), a sign of strength. Support is at 489.00, 480.00, 470.00, 455.00, and 440.00.
MACD (bottom chart) remains on a sell, above 0, and rising. It’s worrisome seeing the higher highs in SPY not confirmed by MACD. It would be a positive in the short term if support at 480.00 holds and SPY closes above last week's high of 496.05. On the other hand, a close below 489.00 could lead to a sharp, quick decline.
Figure 12: S&P 500 Bullish Percent Index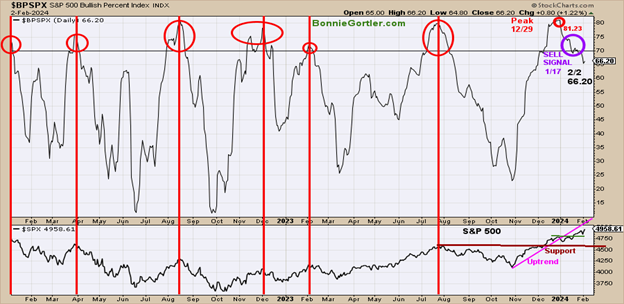
Source: Stockcharts.com
The Bullish Percent Index (BPI), developed by Abe Cohen in the 1950s, is a breadth indicator based on the number of stocks based on Point and Figure Buy signals. The indicator helps you know the market's health and when it's overbought or oversold. When the bullish percent index is above 70%, the market is overbought, and when the indicator is below 30%, the market is oversold. Like other overbought indicators, sometimes it does not get as high or as low. In 2022 and 2023, the indicator reached 70 (overbought) seven times (red circles). Six of the seven were near market peaks (red lines). BPI peaked at 81.00 on 12/29/23. A reading over 70, followed by a retracement below 70, gives a sell signal on this indicator. The current reading as of 2/2/24 is 66.20.
On 1/17/24, BPI generated a sell signal, falling below 70 at 69.80 (purple circle), with the S&P 500 index at 4731.21. The S&P 500 Index (lower chart) closed at 4958.61, up +1.38% for the week. The October uptrend broke at the end of December (pink line), yet there was no downside follow-through. The S&P 500 key support remains at 4600, but below 4800, it would likely increase selling pressure in the short term. BPI remains on a sell. Past performance does not guarantee future results.
Summing Up:
The S&P 500 has moved higher in thirteen of the past fourteen weeks. The rise in large mega-cap stocks is overshadowing the present weakening market internals. Daily momentum indicators on the major averages are not confirming the highs, implying risk is increasing chances of a pullback. The market breadth and up-and-down volume are troubling. More and more negative divergences are visual spread over time. Small Caps are not participating in the rally, which is worrisome. If market breadth does not improve immediately, the bears may come out of hiding sooner rather than later. It's wise to take the time to review your portfolio, with the risk increasing of a pullback is possible at any time. Remember to manage your risk, and your wealth will grow.
Let’s talk investing. You are invited to schedule your Free 30-minute Wealth and Well-Being Strategy session by emailing me at Bonnie@BonnieGortler.com. I would love to schedule a call and connect with you.
Disclaimer: Although the information is made with a sincere effort for accuracy, it is not guaranteed that the information provided is a statement of fact. Nor can we guarantee the results of following any of the recommendations made herein. Readers are encouraged to meet with their own advisors to consider the suitability of investments for their own particular situations and for determination of their own risk levels. Past performance does not guarantee any future results.


