

Yes, the rush up to 5,100 for the S&P 500 (SPY) was impressive, states Steve Reitmeister of Reitmeister Total Return.
Just like last year we see far too much of the recent gains flowing towards the Magnificent Seven stocks. A lot of that is thanks to the "off the charts" earnings report from NVDA. Unfortunately, the wider we look...the harder it is to feel uber-bullish. Especially true with Fed signals pointing to June being the first rate cut (and again...maybe even later than that). This creates an interesting investment landscape where stocks are at all-time highs and yet earnings growth is very low. Not a great recipe for future stock market advances. Let's dig in deeper on this vital topic in this week's Reitmeister Total Return commentary.
Market Commentary
We need to start the conversation with this provocative chart from FactSet comparing the movement of the forward S&P 500 EPS estimates versus the stock index:
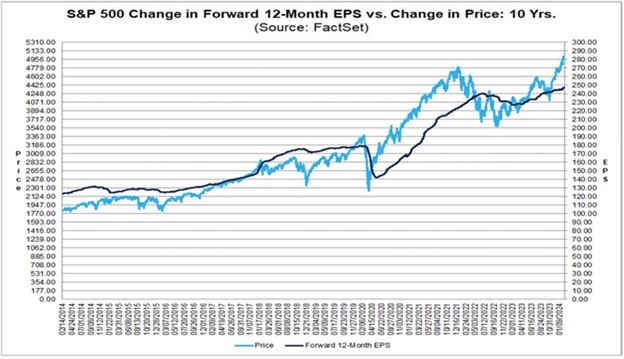
You will discover that for most of the past ten years, the dark line for earnings is above the price action. Meaning the improvement in the earnings outlook propelled stocks higher. Yet each time we find the stock index climbing above the EPS outlook it comes back down to size like it did in 2022. So, it is interesting to ponder that the recent stock surge starting in November was borne under the auspices that the Fed would soon be lowering rates. And yet as time rolls on, we find that is not true with the starting date pushed out further and further.
Last week’s release of the FOMC Minutes reaffirmed the hawkish intent of the Fed to not act too early to lower the rates lest they risk inflation staying above trend far too long. This news, on top of hotter-than-expected CPI inflation #s this past month, has investors recalculating when the Fed will officially start cutting rates. Right now, the odds of the first-rate cut happening at the May first meeting stand at only way down from 88% likelihood a month ago. This has sights sent more on June being the starting line as the market sets that probability at 63% which is good, but not overwhelming conviction.
Back to the S&P 500 earnings chart above...I believe that stocks are running well ahead of the fundamentals. If the lessons of history hold, then it points to two possible outcomes. First, would be a correction for stock prices to be more in line with the true state of the earnings outlook. Something in the range of 10% should do the trick with some of the more inflated stocks enduring a stiffer 20%+ penalty.
On the other hand, stocks could level out for a while patiently waiting for rates to be lowered. This act is a well-known catalyst for greater economic growth that should finally push earnings higher getting things back in equilibrium with the index price. Yes, there is a third case where stocks just keep rallying because investors are not rational. Unfortunately, those periods of irrational exuberance led to much more painful corrections further down the road. So, let’s hope that will not be the case here.
Trading Plan
I believe the 2nd scenario above is the most likely. That is where the S&P 500 levels out for a while. Perhaps clinging in tight consolidation under the recent highs of 5,100. Or perhaps a wider trading range down to the previous breakout level of 4,800. My greatest hope is that the recent rotation to small-cap stocks continues to unfold. For example, over the past three sessions, the S&P 500 has slipped a little from the highs. All the while the small caps in the Russell 2000 have generated a much more impressive +2.2% gain...and finally back into positive territory on the year.
The main point is that we are rightfully in a bull market. Just sometimes the price action gets ahead of the fundamentals. So, this either creates a period of pause...or correction. I sense the former is the most likely scenario. In that environment, the overall market doesn’t move much, but overpriced stocks are generally squeezed down, while value stocks are bid up. We have a tremendous advantage in finding those best-value stocks thanks to the 31 value factors inside the POWR Value model. You and I do not have enough hours in the day to evaluate those 31 factors by hand for all 5,300 stocks measured by the POWR Ratings model.
Gladly the computers do the heavy lifting for us each night making it much easier to hand-select the stocks that end up in our portfolio.
Learn More About Reitmeister Total Return here…


