

After gold hit repeated all-time highs last week, silver may finally come out of its multi-year consolidation and start catching up with the yellow metal this week, states Fawad Razaqzada of Trading Candles.
A move towards $30 is not too optimistic. But there is no major reason why the grey metal cannot go on to achieve its own record high this year. After all, many other assets have done it, like gold, Bitcoin, and many stock indices. Could we see silver at a record $50 at some point this year?
Why Has Silver Underperformed Gold?
We all know what has helped to propel gold to record highs. Years of high inflation and devaluation of fiat currencies have increased the appetite for gold and Bitcoin, which many see as the ultimate store of value and an effective hedge against inflation. BTCUSD hit a fresh record high at $72K on Monday. Gold was a tad off from the record $2195 it hit on Friday. But despite gold’s strong showing of late, this hasn’t yet underpinned silver.
I think it all boils down to silver’s dual uses as a precious metal and an industrial material. This has worked against it, given raised concerns about weaker demand from China for industrial metals.
But with signs China is turning things around, and with the government setting an aggressive 5% growth target, we may well see stronger appetite for industrial commodities like copper and silver this year. This could be the year for silver, after its multi-year under-performance and lack of any major movements since the height of the pandemic in 2020.
Silver Technical Analysis and Trade Ideas
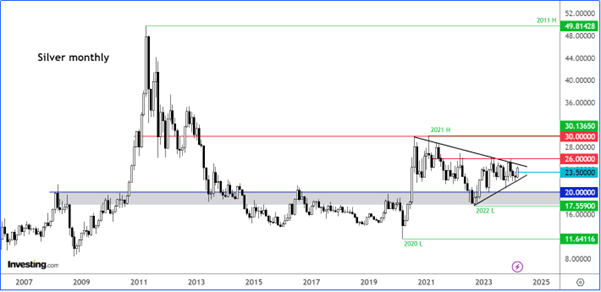
Silver has been in a rather lengthy consolidation between around $19 to $30 ever since the height of Covid in 2020. The 3.5-year consolidation means the eventual breakout could be significant, potentially paving the way for the grey metal to head towards its 2011 all-time high of just under $50. But it remains to be seen whether and when that breakout will take place as gold’s previous runs to nominal all-time highs in recent years didn’t trigger a corresponding move for silver.
Still, it pays to be prepared. Looking at the monthly candles of silver, a breakout could happen soon as the price gets squeezed between two converging trend lines.
Source: TradingView.com
February’s high of around $23.50 is now key support in this time frame. The bulls will not want to see a move back below this level in light of this month’s current +7% rally. The resistance trend line of the consolidation pattern comes in around $25.00 give or take a few dollars. Above this level, we have a horizontal level of resistance circa $26.00, which has proven a tough nut to break in recent years.
So, $25.00 and then $26.00 are the next immediate levels of resistance that the bulls will need to break to trigger a move higher on the larger time frames. Should we see a move above these levels then at the very least I would expect silver to probe its multi-year resistance around $30.00 next.
Meanwhile, if support gives way and silver breaks the bullish trend instead then in that case the bulls will have to wait for a fresh buy signal before having another crack at it. In the near term, it is important not to lose track of short-term price action as the road towards $30 (or even $50) could well be a bumpy one. So, don’t forget to keep a close eye on your lower-time frames, such as the daily or lower if you are an active trader.
All Eyes on US CPI This Week
Looking at the near-term macro perspective, it is all about the next rate cut by the Federal Reserve for FX and precious metals traders, which could be the start of a long cycle of rate cuts, inflation permitting.
Last week, Fed Chair Jerome Powell's testimony was interpreted as dovish, shifting attention towards upcoming US data. Some mild concerns arose from Friday's mixed US jobs data, which pointed to a potential weakening in the labor market when you consider the downward revision to the prior month’s figures and an unexpected rise in the unemployment rate, even as the headline jobs growth beat expectations. The mixed jobs data followed a series of generally weaker US data releases over the past couple of weeks, which have pressured bond yields across the board and bolstered precious metals.
The highlight on the US economic calendar this week is the release of US inflation data on Tuesday. Consensus anticipates a 3.1% year-over-year and a 0.4% month-over-month rise in CPI. Should the actual data fall short of these expectations, or if core CPI fails to meet the projected +0.3% month-over-month figure, it could intensify calls for a rate cut in June and undermine the dollar.
However, a stronger-than-expected inflation report could potentially disrupt the rally in gold and impede silver's progress as well. Nevertheless, considering the dollar's response to robust inflation data last month, any gains the US dollar might experience from unexpectedly high inflation could be short-lived.
Source: TradingView.com
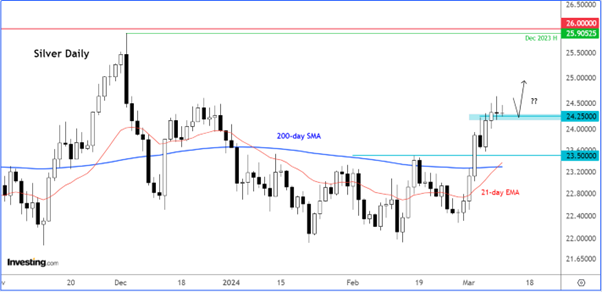
On the daily time frame, one can observe that silver has already broken above $23.50, which is a bullish signal. Now, the 21-day exponential moving average is starting to rise above the 200-day simple average, which is another bullish sign. Last week, silver formed some resistance around the $24.20/5 area, but by mid-week, it broke above this level and held there. Moving forward, this $24.20/5 level is now going to be very important in terms of support. For as long as it holds now then the short-term path of least resistance will remain aligned with the longer-term view: to the upside. A move to probe liquidity above December’s high of $25.90 could well be underway in this time frame.
To learn more about Fawad Razaqzada visit TradingCandles.com


