

Over the weekend, commentators expressed the opinion that last week’s rally in US stocks is starting to cool, states Ian Murphy of MurphyTrading.com.
The long-term bullish trend which resumed last November (black arrow) remains solid and intact since the S&P 500 (SPX) closed back above the 21 period Exponential Moving Average.
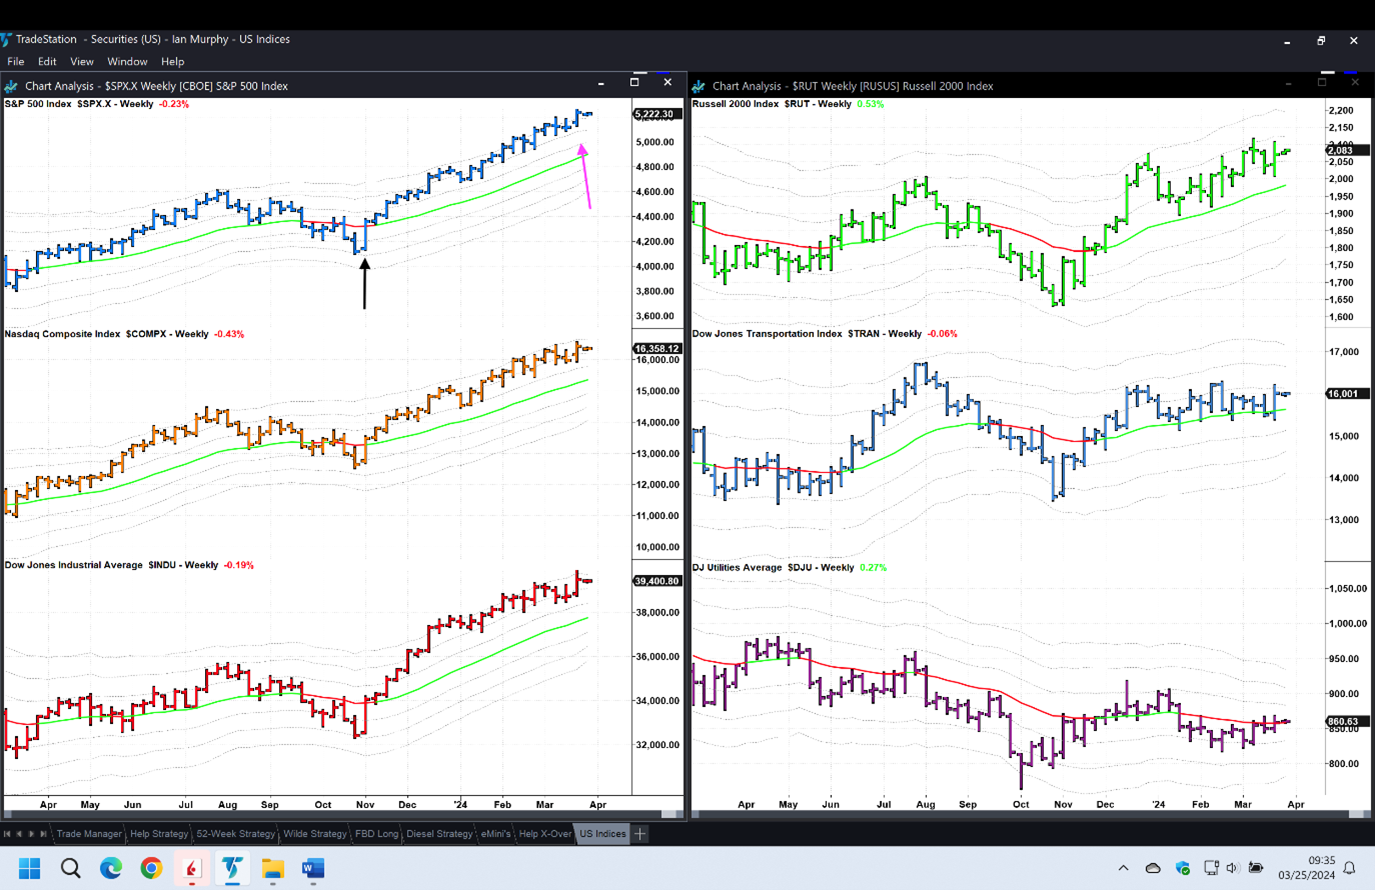
When we are feeling nervous about the market or have concerns about individual positions, dropping down to a weekly chart like the one above helps to identify the current market trend. And right now, the S&P 500 is as bullish as it gets having failed to even touch the 1ATR line in the last five months. So long as it stays above that line (pink arrow), the market is bullish and long-term weekly trend-following trades are more likely to be successful.
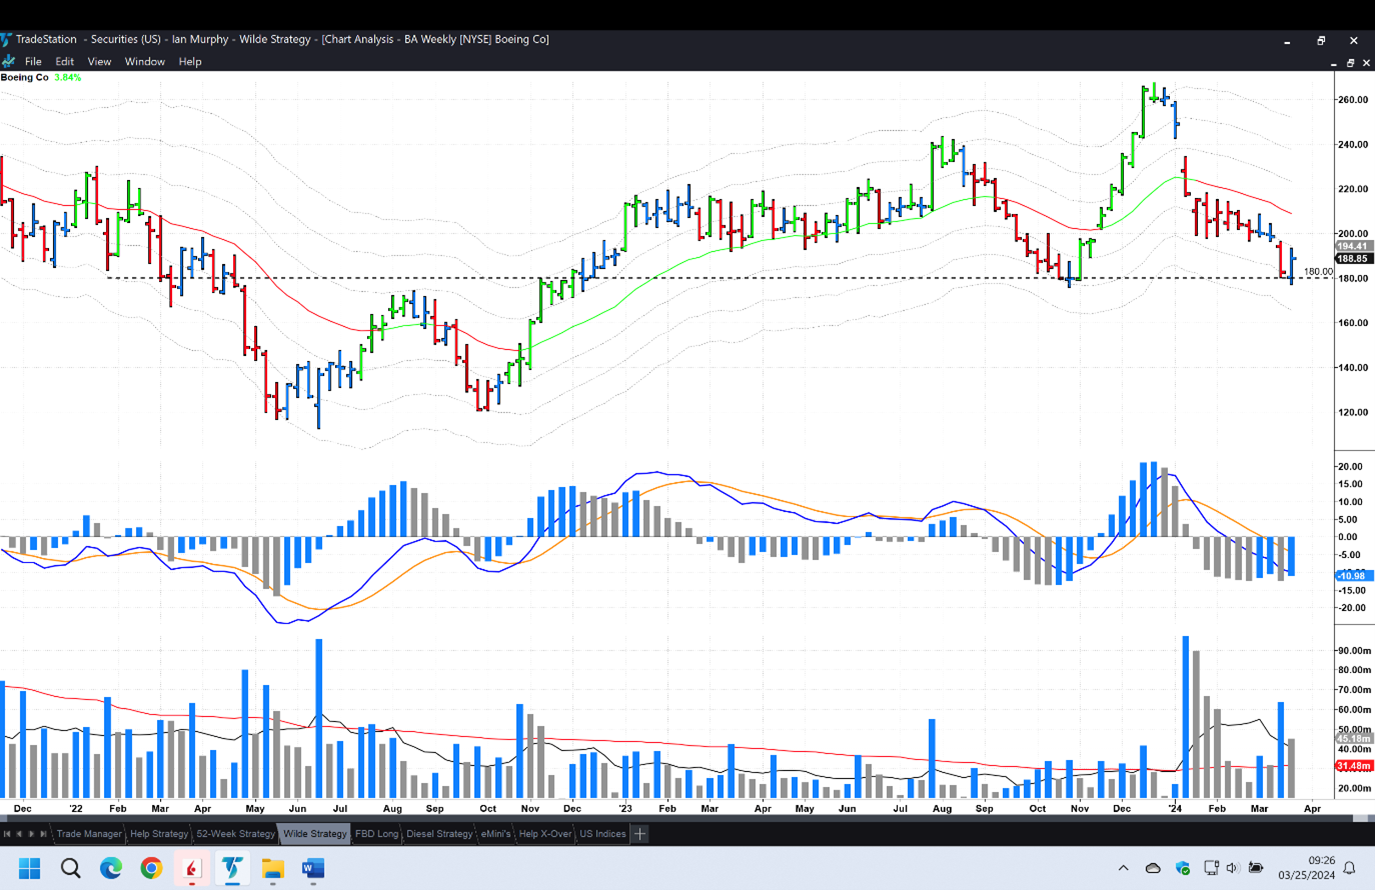
Shane P. has asked if the recent troubles at Boeing (BA) present a buying opportunity, so let’s make it a Trade Idea. There is solid horizontal support and resistance at $180 (black dashed line), and that line was tested again last week and appears to have held so far. If opening a position, that line needs to hold, so a soft stop (weekly closing basis) can go there. If we start to see a close below that price, it would be time to exit.
After that, the -1ATR (currently $194.41) is where the soft training stop should go if BA rallies from here.
Learn more about Ian Murphy at MurphyTrading.com.


