

Gold fell in the first half of Monday’s session, apparently due to profit-taking following its 2.5% gain last week that saw the metal end a two-week losing streak, states Fawad Razaqzada of Trading Candles.
The underlying trend remains bullish with the metal on course to potentially end higher for the third consecutive month. The metal was ascending again for much of last week, before falling back a little at the start of this week. It found decent support ever since the release of the weaker April non-farm payrolls report. Gold found additional support in the latter half of last week, as the dollar fell after the latest jobless claims data provided fresh evidence of a cooling US labour market, helping to support the view that the Federal Reserve is going to cut rates by around September.
So, gold’s recent gains partly reflect a weaker dollar and increased odds of a rate cut by the Fed. This week, the US dollar will be put to a big test as we have a couple of significant data releases coming up.
Key Us Inflation Data in Focus This Week
The US dollar, and by extension gold, could be impacted significantly by the release of this week’s key inflation data on the US economic data calendar. We will have PPI data on Tuesday, followed by CPI on Wednesday. Retail Sales and the Empire State Manufacturing Index are also due on Wednesday. Thursday will see the release of Housing Starts & Permits, as well as the Philly Fed index, industrial production, and weekly jobless claims.
For gold, the focus is on signs of a weakening economy and labour market versus continued inflationary pressures. This week’s key inflation data will provide us with big clues in terms of the duration of high interest rates.
Following another sharp rise in the UoM’s Inflation Expectations survey to 3.5% vs. 3.2% last month, as we found out on Friday, the latest PPI and CPI data for April have the potential to intensify or reduce inflation concerns significantly depending on the direction of the surprise. CPI has consistently beaten expectations since the turn of the year. The Fed and dollar bears will be hoping to see a softer print for a change, else rate cut expectations could be pushed out further. CPI is seen easing to 3.4% y/y in April vs. 3.5% the month before. On a month-over-month basis, a 0.4% rise is expected in the headline CPI and a 0.3% increase in core CPI.
Gold Remains Fundamentally Supported
It has been apparent this year that gold traders are happy to buy any dips they can get their hands on. Given the strong trend on precious metals this year, you wouldn’t blame them either. Today’s weakness could provide another dip-buying opportunity.
Gold has been driven this year by strong demand amid ongoing central bank purchases and increased inflation hedging. Years of above-forecast inflation have reduced the purchasing powers of global currencies, and in some cases drastically so, increasing the need for alternatives to fiat currencies. Gold has stood out as a clear alternative.
China’s ongoing efforts to support its economic recovery are also helping the cause given that they are the top consumers of gold as a nation. News of the nation’s plan to sell ultra-long special bonds could help commodities further.
Gold Technical Analysis and Trade Ideas
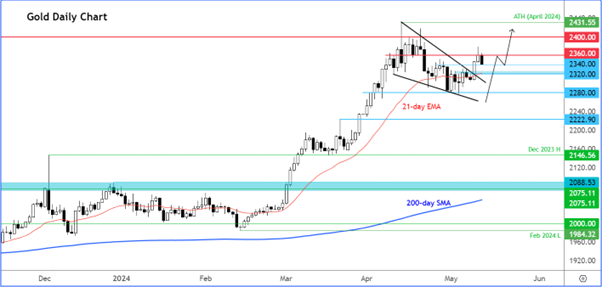
The gold chart had been confined within a descending wedge pattern in recent weeks, following its earlier record-breaking breakout. Last week however, it broke out of this continuation pattern, suggesting that the metal is potentially ready to take off again especially as the recent consolidation has allowed momentum indicators like the RSI to reset from their "overbought" levels through both time and price.
The bulls now have the breakout above the wedge pattern's resistance trend to signal a continuation of the uptrend, so I wouldn’t be surprised if gold starts to chip away at the next resistance in around the $2360-80 area.
Subsequent bullish targets above $2460 include $2400, followed by the record high that was hit earlier in April at $2431. But the potential rally could easily extend far beyond that level once the ball gets rolling.
While I am bullish, I still wouldn’t rule out the potential for a more pronounced drop below these levels despite last week’s breakout from the falling wedge pattern. It is still better to be prepared for all possibilities—especially with the key event risk facing us this week, namely the CPI data.
So, watch your key support levels closely. On the downside, the first level of support at $2340 was being tested at the time of writing. Below here, $2320 is the next level to watch, which was the point of the origin of last week’s breakout above the bearish trend of the wedge pattern. A potential break below $2320 may put the bulls in a spot of bother.
However, I will only consider short gold setups if and when I see a clear bearish reversal pattern. For now, dip-buying remains the name of the game.
To learn more about Fawad Razaqzada visit TradingCandles.com


