Harmonics are very repeatable patterns that accurately predict high-probability trade set-ups with high risk-reward ratios, explains Derek Frey, who also reviews a recent trade.
There are thousands of different technical analysis patterns that you can read about in books, watch in videos, and read about online.
Our guest today is Derek Frey; he's got harmonic patterns that he uses. He is going to talk about that. So Derek, first of all, what is a Harmonic pattern?
A Harmonic pattern is a series of successive Fibonacci expansion and retracement ratios that come together to form what we call a Harmonic pattern. Once it shows up, it gives us a certain amount of probability.
It doesn't predict the future, of course-nothing really does-but it forecasts a certain amount of probability of what is most likely to happen.
So we use that, we couple that with a favorable risk/reward ratio, and that is ultimately what gives us our mathematical edge that we use thousands of times over to be consistent with.
See related: Make Sure Risk/Reward Is on Your Side
And Derek, you have a chart that shows an example of that.
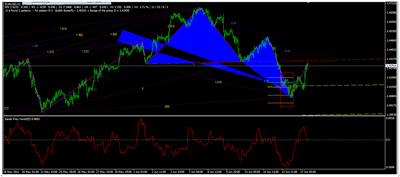
Yeah, here we have a chart of the euro where we had a butterfly harmonic pattern that showed up recently and gave us about 150 points worth of profit for less than 50 points worth of risk, so we had a 3:1 risk/reward ratio. It has now really completed itself on this move back up.
So is the harmonic pattern the triangles, the blue areas?
Yeah, the blue areas are the pattern. That is the stuff that has to come together to form the pattern. We don't actually trade any of that stuff while it is under construction, so to speak, but you see the little red box there, that is the entry zone, it is called the PRZ, the potential reversal zone.
That is where we get in, and then, in this case, it is a bullish one, so our stops originally were below that box, and after achieving a 50% profit on our original risk, mainly, we have broken even, and so on.
So once the pattern enters this box, that is the point you would buy
or sell?
Yeah, it is a little more complicated than that because
there has to be a certain amount of favorable positive expectancy or risk/reward
ratio in it for it to qualify as one that we would actually take.
That is what I was saying before; there are many, many patterns that show up, but we go through a process and it is really based on risk to reward.
How do you determine that risk to reward on a chart like this?
Well the risk is of course your entry to your stop, and for the reward, we use a target on what is called the B point, which is the center between where the two triangles touch each other; basically, the heart of the pattern, so to speak.
So simply measuring whatever your entry point would be back to that point versus your entry point to the stop, and if the ratio is (in my world) at least 1.5 to 1 or greater, you are good to go.
So how did you come across harmonic patterns, or how did you settle on this when there are so many patterns out there to watch?
The original pattern is the Gartley pattern, and that of course was discovered by H.M. Gartley back in the 1930's. I read his book a long time ago and it piqued my interest, basically, and I was searching for something that would give me a really solid statistical edge.
I don't even get into trades anymore unless I have at least a 70% edge, and that is because of these, because they are a minimum threshold for them to even show up. I have to have at least 70%, so that is a solid edge.
Related Reading:


