
The first quarter of 2024 is officially in the books. So, WHO is winning the markets race? And what does that say about Q2 and beyond? You might be surprised!
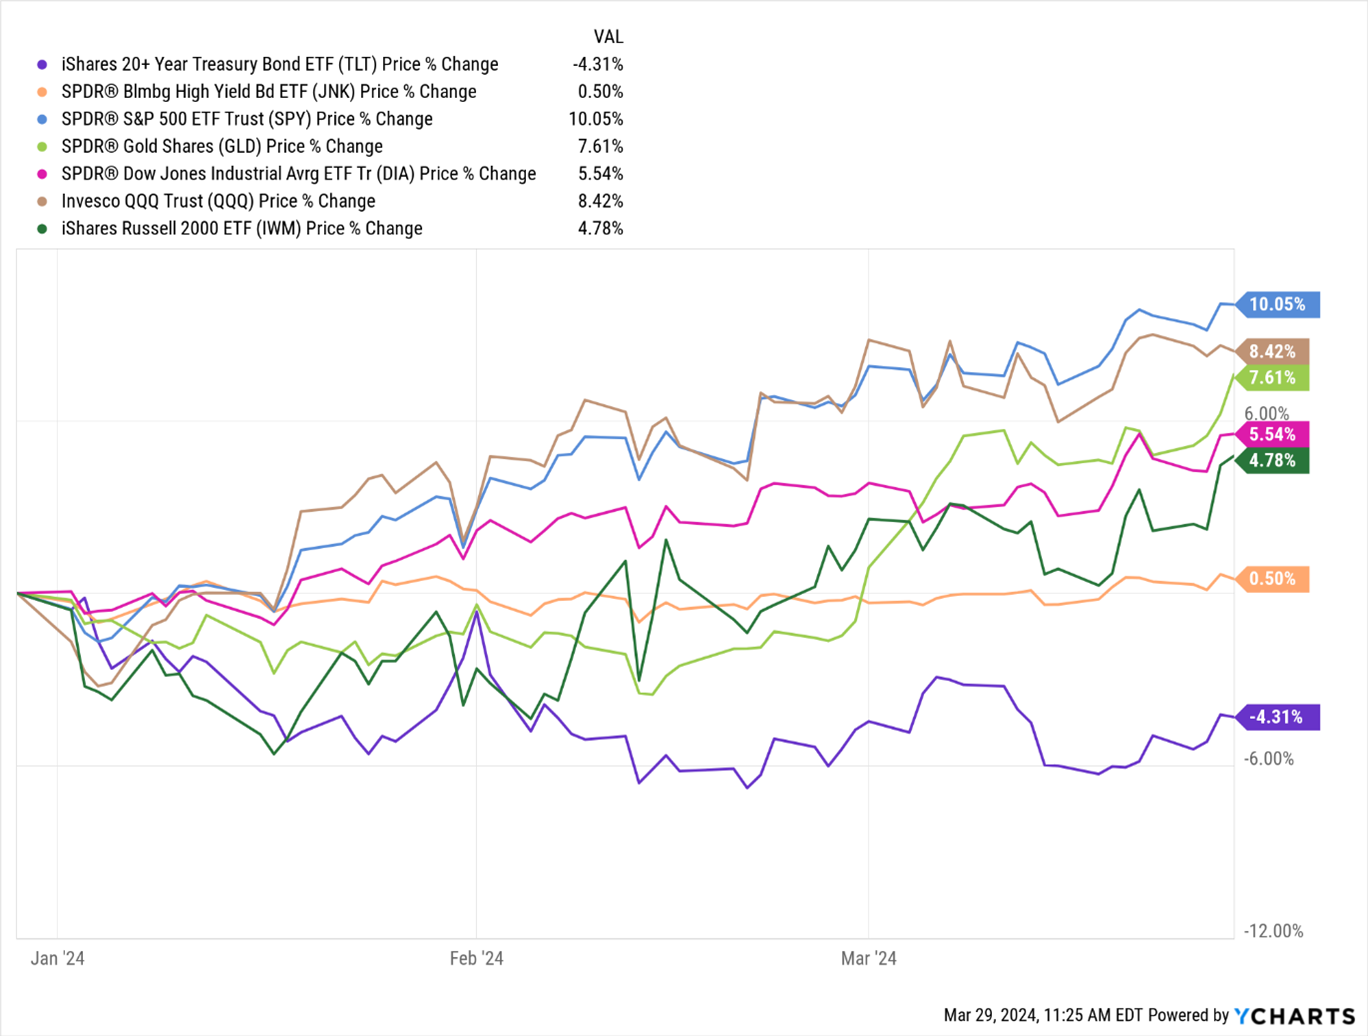
Here’s the MoneyShow Chart of the Week showing the performance of several ETFs that track different asset classes and indices. That includes the iShares 20+ Year Treasury Bond Fund (TLT), SPDR Bloomberg High Yield Bond Fund (JNK), and SPDR Gold Shares (GLD) for government bonds, “junk” bonds, and gold.
For the major averages, I’ve included the SPDR S&P 500 ETF (SPY), the SPDR Dow Jones Industrial Average ETF Trust (DIA), and the Invesco QQQ Trust (QQQ). You’ll also find the iShares Russell 2000 ETF (IWM) in the mix.
Data by Ycharts
What stands out? How about...
- It’s no April Fools’ Day joke. Tech/QQQ is now lagging the S&P 500/SPY year-to-date...while the Dow/DIA and the Russell 2000/IWM are playing “catch up.” That speaks to the ongoing transition from a Mag 7/Big Tech-driven market to a market with more participation and breadth.
- Plain-vanilla Treasury bonds continue to generate losses. But higher-yielding, riskier bonds are doing better, slightly in the green YTD. That’s a sign markets are relatively comfortable, rather than fearful, when it comes to credit risk.
- Gold is REALLY turning on the jets here, with YTD returns almost as good as tech stocks. While some may claim gold is an old-school asset in a new-school, tech-driven world, profits are profits. And right now, gold is doing just fine, thank you very much!
As for what these trends say about the full year? Well, the basic message is “It’s a new market with new leaders.” Consider adding exposure to what’s working best now, rather than what might have worked best in the past.


