
Yes, there’s a TON going on in this market. And yes, that means there are TONS of interesting charts I could choose from for this post-holiday MoneyShow Chart of the Week piece.
But I can’t NOT talk about “That Stock,” right? So behold...Nvidia Corp. (NVDA)!
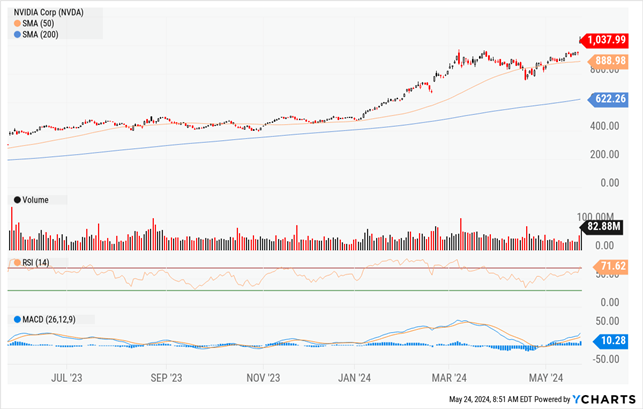
Data by YCharts
Forget the tech company’s blowout Q1 earnings report. Forget everything you’ve heard about Artificial Intelligence (AI) computing demand. Forget what visionary CEO Jensen Huang has said about the future of his company or “AI Factories.” Even try to forget the fact Huang’s personal wealth has ballooned to $90 BILLION thanks to the 28X rise in NVDA over the last five years!
Instead, just look at the NVDA chart and the indicators. When you do, it’s hard to argue with the uptrend here.
The steadily rising 200-day Moving Average. The recent rebound above the 50-day MA after a “fake out” breakdown. And of course, the massive breakout above prior highs on heavy volume last Thursday. It’s pretty powerful stuff.
If there is a fly in the ointment, it’s that RSI and MACD aren’t indicating quite as much buying power/strength behind the recent move as you’d like to see in a perfect world. But I’m not going to quibble too much. This stock is a beast – and fighting the trend doesn’t look like a smart play to me.


