
Investors know the Federal Reserve WON’T cut rates when this week’s policy meeting wraps up on Wednesday. But that doesn’t mean the Great Rate Debate is settled. Far from it.
Instead, Wall Street is wrestling with what happens NEXT! In other words, the debate is focused on the “When?” and “By How Much?” questions that pertain to FUTURE Fed rate cuts.
So, what do you need to know? And how can that information help you profit?
I’ll start with this handy chart from the Council on Foreign Relations. The nonpartisan think tank tracks central bank policy rates all over the world and produces an aggregate index – one that shows whether rates are generally rising or falling globally.
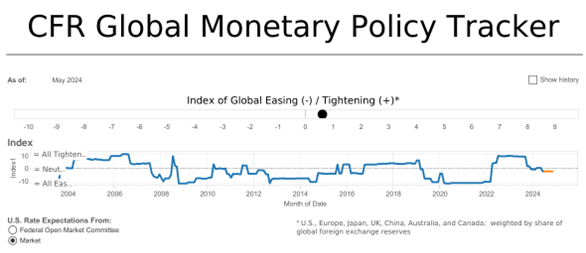
Source: Council on Foreign Relations
Check out the far right and you’ll see that we’re coming off the boil. The index spent most of 2022-2023 in “tightening” territory...but now, it is falling below the center line. We’ve recently seen central banks in Switzerland, Canada, and the eurozone cut rates – and that’s fueling speculation the US Fed will have to follow before long.
That brings me to your primary MoneyShow Chart of the Week. It shows the iShares 20+ Year Treasury Bond ETF (TLT) going back one year. Since bond prices move in the opposite direction of bond yields, a rising TLT means yields are falling.
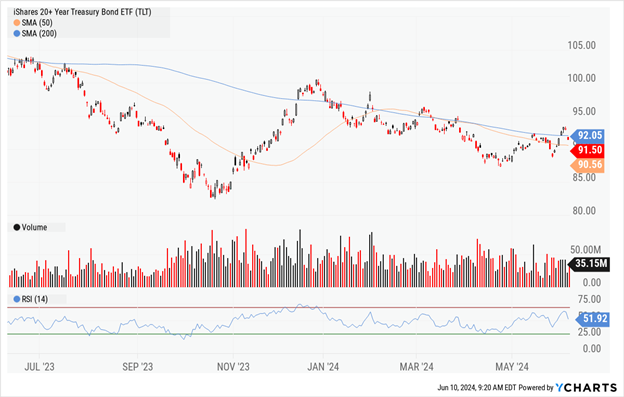
Data by YCharts
Sure enough, you can see that TLT poked its head above the 200-day moving average last week, before pulling back on Friday following the latest jobs report. You can also see how the ETF has been making a series of higher lows in the short term – and how RSI has been perking up.
We’re NOT out of the woods. These trends ARE tentative. BUT if you couple that technical trading action with a more favorable global policy backdrop, you have a recipe for potential profits. At the very least, you may want to consider shifting more money into longer-term bonds – including governments, high-quality corporates, and related ETFs and mutual funds.


