
Health care has not disappointed in its role as a market-leading sector, and a look at three pharma names and the sector ETF produces yet another chance for investors to join in.
Stocks have declined steadily from the early July highs as more important support has been reached. The bull and bear debate has not yet been resolved, but could be with a weak close on Friday.
One constant since the April highs has been the steady upward progress of the health-care sector. The Select SPDR Health Care (XLV) made new highs for the year just a week ago, while the Spyder Trust (SPY) is still 5% below its April 2 high.
Several of the major drug companies have been leading the health-care sector higher, and technically they still look strong. One leading drug stock has been lagging, but now looks ready to catch up, as an upside breakout looks likely.
Click to Enlarge
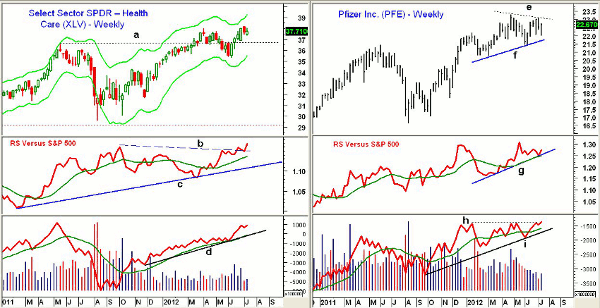
Chart Analysis: The Select SPDR Health Care (XLV) shows the breakout above major resistance at $36.70 (line a) in March.
- The next resistance is in the $39 area, with the weekly Starc+ band at $39.25. The monthly Starc+ band for July is at $41
- The relative performance, or RS analysis moved back above its WMA in April, signaling that it was becoming a market-leading sector
- The RS line broke through resistance (line b) in June, and looks ready to make another new high this week
- The weekly on-balance volume (OBV) surged in early June, and continues to look positive, but has not yet surpassed the highs from 2011
- There is initial support now in the $37 to $37.20 area
Pfizer (PFE) is a huge $170 billion drug manufacturer that has been disappointing the market for several months, as it is still below the April high of $23.30.
- The weekly chart shows a triangle or flag formation (lines e and f) which is a typical continuation pattern
- A weekly close above $23.10 will have Fibonacci targets at $23.85, with further upside targets in the $25 to $26 area
- The relative performance has turned up from support and its rising WMA, which is a positive sign
- The OBV is very close this week to breaking through major resistance (line h), and is leading prices higher
- The daily volume yesterday was the heaviest since June, but the daily OBV (not shown) is still below its WMA
- There is near-term support now in the $21.90 to 22.20 area, with more important levels at $21.40
- PFE has a current yield of 3.9%
NEXT: Tom’s Verdict on 2 More Pharma Names
|pagebreak|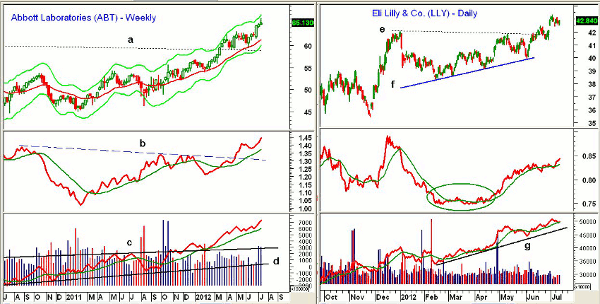
Click to Enlarge
The weekly chart of Abbott Laboratories (ABT) shows that major resistance (line a) was overcome early in 2012. The breakout level in the $59 area was retested in April.
- ABT came very close to its weekly starc+ band this week, and there are upside targets in the $67 to $67.50 area
- The relative performance has been in an uptrend since late 2011, and broke through resistance in April (line b)
- The RS line has turned up more sharply in the past few weeks
- The weekly OBV broke out of its major trading range (lines c and d) in late 2011, and has been leading prices higher
- Volume has been strong over the past two weeks
- Minor support now at $64 with stronger in the $62.50 to $62.80 area
- ABT has a current yield of 3.1%
Eli Lilly (LLY), at $47.8 billion, is the smallest of these three drug manufacturers. The flag formation (lines e and f) was completed in mid-June.
- The breakout level was retested a week later, and the 127.2% Fibonacci retracement target at $43.15 has already been reached
- There are additional upside targets in the $45.50 to $46.50 area
- The relative performance completed its bottom formation (see green ellipse) in April
- The daily OBV rallied sharply in April, and is in a strong uptrend (line g)
- There is minor support in the $42.40 area, with further levels at $41.80 to $42
- LLY currently yields 4.6%
What it Means: The Spyder Select SPDR Health Care (XLV) was a favored sector at the start of the second quarter, and shows no signs yet of topping out.
The big drug companies have acted well in addition to paying nice dividends. PFE has been lagging, but now looks ready to catch up, and it looks attractive for new buying.
How to Profit: For Pfizer (PFE), those who are not already long could go 50% long at $22.54 and 50% long at $22.22, with a stop at $21.29 (risk of approx. 5%).
Portfolio Update: For Pfizer (PFE), investors should be 50% long at $22.22 with a stop at $21.29. Would add another 50% at $22.22 or better with the same stop.
For the Select Sector SPDR Health Care (XLV), investors should be 50% long at $36.04. Use a stop at $35.12.
For Abbott Laboratories (ABT), investors should be 50% long at $61.14 and 50% long at $60.22, with a stop now at $60.81. Sell half at $67.44.
 For Eli Lilly (LLY), investors should be 50% long at $40.52 with a stop now at $40.68.


