These global ETFs have badly underperformed major averages, and the charts indicate that further weakness still lies ahead.
The dismal performance of the US market on Friday and the sharp decline in several of the European markets makes the early action this week more important. While the S&P 500 closed right on important support and very close to the recent lows, some averages do not look as bad.
I will be watching the action of the Dow Transportation Average and the Russell 2000, as both are still well above the lows they made earlier in June. The Transports in particular have been a good market barometer since the March 2009 lows, as they have led the market out of several past corrections. The NYSE McClellan Oscillator also still shows a pattern of higher lows.
Though the small 0.9% gain in the S&P 500 so far in 2011 has disappointed many investors, things were worse overseas. The MSCI World Average is down 1.5%, and if you were in some of the single country ETFs, their performance was worse than that.
Relative performance, or RS analysis, can also be useful on a global basis, as investors can compare the performance of a country ETF to global market average like the MSCI World Index.
This can be a two-step process for US investors, who first can find the country ETFs with the best RS analysis versus the world and then see how the same country ETFs compare to the performance of the S&P 500. This will allow for more informed investing decisions.
This analysis of four widely followed country ETFs will illustrate why they have performed worse that the MSCI World Average and the S&P 500 and will highlight the signs that will indicate when these funds become attractive investments once again.
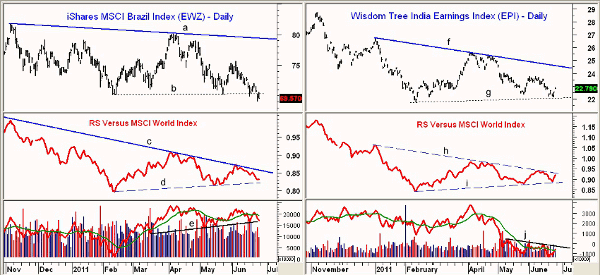
Chart Analysis: The iShares MSCI Brazil Index Fund (EWZ) dropped below trend line support, line b, on Thursday, although it did rebound on Friday. For the year, EWZ is down 10.1%. If the fund breaks the recent lows at $69, the next good support is in the $67 area.
- RS analysis versus the MSCI World Index tested its long-term downtrend, line c, earlier in June before turning lower
- The RS is now very close to good support (line d). If the RS can hold this support and then move back above the June highs, it would be a positive sign
- Daily on-balance volume (OBV) is also holding up better than prices, as the support, line e, is holding so far
- EWZ has first resistance now at $71-$72, while a close above $75.65 would be positive
The Wisdom Tree India Earnings Fund (EPI) is down 13.6% for the year, which is considerably worse than the Bombay Sensex Average’s 11.1% loss. EPI bounced on Friday from support in the $21.70 area (line g), which goes back to February.
- There is next resistance for EPI in the $23.70-$24 area with the daily downtrend (line f) at $24.60
- RS analysis is showing some improvement, as it has formed a series of higher lows, line i
- EPI is not far below its downtrend, line h, and an upside breakout would be a sign that it is starting to perform better than the MSCI World Index. A series of higher highs and higher lows would confirm that a bottom was in place
- No positive divergences in the daily OBV, and a move through the resistance at line j would be a short-term positive
- On a drop below $21.70, the next support is in the $20 area
NEXT: More Underperforming ETFs to Avoid
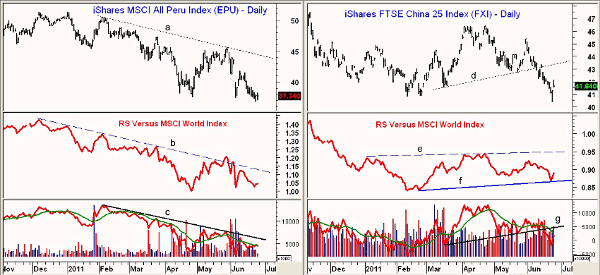
|pagebreak|The chart of the iShares MSCI All Peru Index Fund (EPU) is a good example of how hazardous it can be to invest in single-country funds without using appropriate risk controls. Political instability has weighed heavily on Peruvian companies.
- EPU is down 25% so far in 2011 after closing 2010 at $50.36
- New correction lows were made last week at $36.78 with the next band of good support from 2010 in the $34.70-$35.50 area
- The downtrend in the RS, line b, was briefly broken in June, but there are no signs yet that a bottom is forming. A move above the May/June highs would improve the outlook
- The daily OBV is still in a year-long downtrend, line c, but is slightly above the previous lows. Volume was not especially heavy last week
- Daily chart resistance is initially in the $41.50-$41.70 area with the daily downtrend, line a, at $44.35
Though the Shanghai Composite and the Chinese economy are big concerns to many global investors, I was surprised to see that the composite was down only 1.7% for the year while the widely followed iShares FTSE/Xinhua China 25 Index (FXI) is down 3.3% for the year. Though some country ETFs have done worse than FXI, it is an interesting example using RS analysis.
- FXI gapped through support, line g, on June 10 and hit a low last week of $40.35. There is next good support from 2010 in the $38.65-$39 area
- The RS turned up on Friday, but the year-long trading range, lines e and f, is still intact
- Buying or selling stocks or ETFs when the RS analysis is in a trading range is generally not a good idea. Though you can get sharp rallies or declines, the chances of a decent trend are low
- The completion of a six- to eight-month trading range in the RS, on the other hand, can generate very valid signals
- The OBV violated support, line g, over a week ago, as the selling picked up. The weekly OBV (not shown) dropped below its weighted moving average (WMA) in early June and is also still negative
- FXI now has first resistance at $42.50-$43.50 with much stronger resistance above $45
What It Means: Though many form their opinions of the stock market’s performance by looking at broad averages, this is often misleading. As Friday’s sector analysis revealed, the worst sector was down 9.4% while the best was up 6%. This is quite different from the 3.2% decline in the S&P 500.
The relative performance, or RS analysis, can also keep you out of the worst-performing country ETFs and often alert you to good opportunities. Of the four ETF discussed here, the Wisdom Tree India Earnings Fund (EPI) is the only one that currently looks close to forming a bottom.
How to Profit: I see no new opportunities in any of the four ETFs I have covered here, and any investors who are currently long should clearly be using safe stops. The outlook could change in the next month or so, however, so these are all funds that are worth watching.


