
Stocks and gold enter October amid high volatility and downside risk, meaning caution is warranted now in advance of potential buying opportunities later on.
September was a rough month in the markets, and the wave of selling last Friday did not help. The S&P 500 was down 7.2% in September and 14.3% for the quarter. For the year, the Dow Transports are down almost 18%, which looks pretty good when compared to the KBW Bank Index, which has lost 32.3%.
Commodity traders were also hit, as a surprising crop report pushed corn and wheat limit down in Friday’s session. Even gold was not immune, as the SPDR Gold Trust (GLD) lost 11% in September, though it is still up close to 14% for the year.
So what can we expect in October? Since 1950, stocks have been higher 60% of the time, but the average return is only around 1%. October has generally been a weak time for gold, and further weakness would certainly dampen the rampant bullishness that prevailed in August.
Technically, there was some damage done last week, so volatility is likely to remain high for the next week or two, but by year end, we may look at October as a month of opportunity.
Click to Enlarge
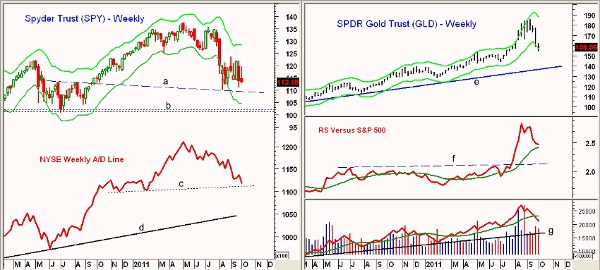
Chart Analysis: The weekly chart of the Spyder Trust (SPY) shows that the Starc- band was exceeded for two weeks in early August. Since then, SPY has been range bound and is midway between the weekly Starc bands.
- The close last week turns the focus on the downside with chart and trend line support at $110.27 to $109.57 (line a)
- There is converging support in the $101-$102.20 area, which includes the major 50% Fibonacci retracement support from the 2009 lows
- The weekly NYSE Advance/Decline (A/D) line has dropped below the most recent lows but is still above next strong support from late 2010 and early 2011, line c
- The A/D line is acting stronger than prices and did confirm the price highs in April
- Major A/D line support is much lower at line d
- There is a broad range of resistance between $115 and $122
- The daily McClellan Oscillator is at neutral levels of -52 but could quickly get back to oversold levels after a couple of days of weak A/D numbers
The SPDR Gold Trust (GLD) closed on the weekly Starc- band again last week, signaling that GLD was still in a high-risk sell area. Gold is up sharply in early-Monday trading and an oversold rally is overdue.
- There is first resistance at $161-$162 with much stronger resistance in the $164-$166 area
- Minor 50% retracement resistance is at $170, where a further rally should fail
- The RS analysis has dropped sharply over the past few weeks as GLD has been weaker than the S&P 500
- The breakout above resistance in August, line f, suggests that GLD should continue to outperform the S&P 500 over the intermediate term
- Weekly on-balance volume (OBV) did form a negative divergence in August and has dropped below its weighted moving average (WMA). It is still well above major support at line g
- Daily OBV (not shown) is still below its declining weighted moving average
- The decline last week violated the minor 50% retracement support level at $156.82, but has held so far above the weekly chart support from the May 2011 highs at $153.62
- Minor 61.8% retracement support is at $149.98 with the weekly uptrend, line d, in the $147 area
NEXT: Latest Charts for Dow Transports, Nasdaq 100
|pagebreak|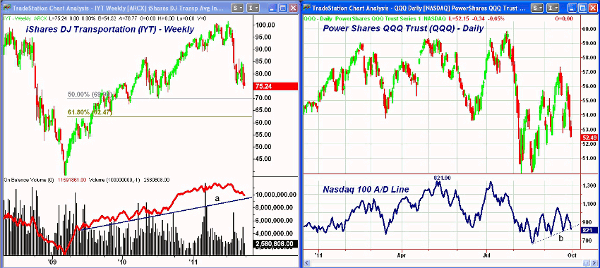
Click to Enlarge
The action of the iShares Dow Transportation Average (IYT) since the July highs has been negative for the overall market. IYT made new correction lows just over a week ago at $73.99 and looks ready to test the lows.
- The major 50% Fibonacci retracement support is at $69.99 with some minor support in the $72.74 area
- Volume was lower on the most recent lows and the weekly OBV is still holding well above the major uptrend, line a. The weekly OBV did form a negative divergence at the highs
- The daily OBV (not shown) is slightly negative and volume was low last week
- There is first resistance in the $80 area with much stronger resistance at $83-$85 area
The PowerShares QQQ Trust (QQQ) was also hit hard last week, and the sharp decline in Baidu.com (BIDU) did not help.
- QQQ is still holding well above the August lows in the $50 area. There is also minor support at $52
- The Nasdaq 100 A/D line is on the verge of breaking its short-term support, line b, but is still well above the August lows
- There is minor resistance at $54-$54.50 and a close above the $56.20 level is needed to turn the short-term trend positive
- The daily OBV (not shown) is just slightly negative
What It Means: Last Friday’s drop and new concerns about Greece over the weekend suggests favoring cash and avoiding risk will be the focus early this week. For stocks, a test or a marginal break of the August lows still looks most probable, as bearish sentiment is still high. This suggests another major decline is less likely, but cannot be ruled out.
As for gold, the first decent three- to eight-day rebound should allow us to better determine how low gold may go and how long the correction might last.
How to Profit: If you have hedged some of your stock portfolio, stay with it until we get clear signs that the market has bottomed out.
I previously advised covering half of your hedge on long GLD positions and would hold the other half position for now. If we get a decent rebound, a further hedge may be warranted.


