
Credit card companies are entering a seasonally strong period, but putting the flashy commercials aside, not all of them are good investments at this time. MoneyShow's Tom Aspray looks at the charts of the major players to determine the best buys.
On Friday, we get the August readings on retail sales. Most are expecting a 0.7% rise, which would follow the 0.8% gain for July reported last month.
We're also about to get the mid-month reading from the University of Michigan on consumer sentiment. Many are trying to determine consumers' willingness to shop as we head into the holiday season.
Same-store sales rose 2.7% last week, much better than the 1.8% average estimate, as Gap (GPS) and Macy’s (M) both reported healthy increases over last year’s results.
As I noted in July, we are now in a strong seasonal period for the retail sector. Many of the retail stocks, like Macy’s, are already sharply higher.
This is also a critical period for the credit card companies, and technically some of them look like good buys now.
Click
to Enlarge
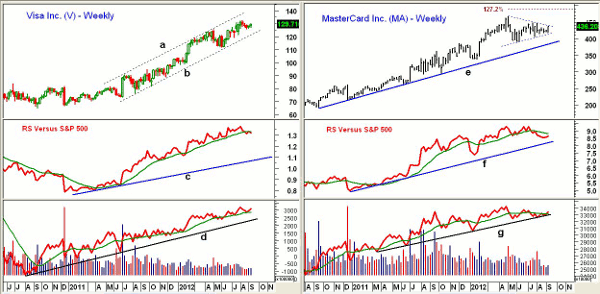
Chart Analysis: The weekly chart of Visa (V) shows a solid upward trading channel (lines a and b) from the lows in the summer of 2011.
- The upper boundary of the trading channel is now at $141.80, which is 9.3% above current levels. The monthly Starc+ band is now at $143.80
- The weekly relative performance or RS analysis did confirm the recent highs, but is now just barely below its WMA.
- The RS line is still in a clear uptrend, and is well above its long-term uptrend (line c).
- The on-balance volume (OBV) tested its WMA two weeks ago, and has now turned higher.
- The OBV did confirm the recent highs, and is well above the long-term uptrend (line c).
- There is first support at $128 to $129.40, with more important levels in the $125 area.
MasterCard (MA) peaked in May at $466.98, and has since formed a short-term flag or triangle formation. There is next resistance at $448, and a weekly close above this level will complete the triangle formation.
- The Fibonacci target from the flag formation is at $487.60, which is 11.9% above the current level.
- The weekly RS line did confirm the May highs, but dropped below its WMA in the latter part of July.
- The RS line is still well above the late 2011 lows and the long-term uptrend (line f).
- The weekly OBV has been testing its uptrend (line g) that goes back to early 2011, and it has now moved back above its WMA. A breakout in the OBV may precede a breakout in prices.
- There is initial support now at $430 to $432, with much stronger levels in the $423 to $426 area.
NEXT: Tom's Verdict on 2 More Credit Names
|pagebreak|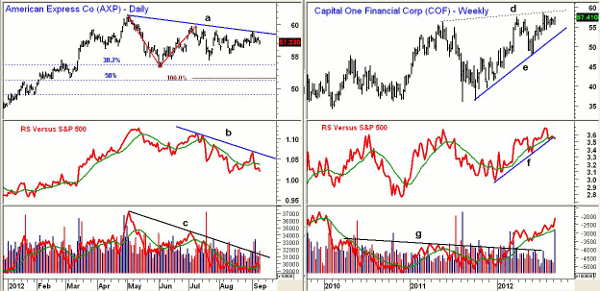
Click
to Enlarge
American Express (AXP) peaked in April at $61.42, and has since been in a wide trading range. It dropped as low as $53.18 in June, which was just below the 38.2% support level.
- The daily chart appears to show a continuation pattern or a pause in the longer-term uptrend.
- Using the decline from the April high to the June lows and projecting down from the July highs, you get a Fibonacci equality target of $51.60, which is just above the 50% support at $51.30.
- The daily relative performance, after confirming the highs, has formed lower highs (line b).
- The weekly RS analysis (not shown) is still in an uptrend and positive.
- The daily OBV is in a four-month downtrend (line c), but the weekly OBV did confirm the recent highs.
- A daily close above the resistance at $59.20 will be the first strong sign that the correction is over.
Capital One Financial (COF) has been in a strong uptrend since the October 2011 lows. The upper trend line resistance (line a) is in the $59 area.
- The bearish interpretation of this chart is that it is a rising wedge, which if completed by a break of support (line e) would signal a sharp plunge.
- The technical studies, especially the OBV, are favoring an upside breakout with next major resistance at $63.50.
- The weekly RS line is currently testing its WMA and the uptrend (line f). It did make significant new highs in the past few weeks.
- The weekly OBV completed a major bottom in early 2012, as it overcame two-year resistance (line g).
- The volume was strong last week, and the OBV has turned sharply higher.
- There is support from the past few weeks at $55.60, with stronger levels at $54.50.
What it Means: The weekly analysis of Visa (V), MasterCard (MA) and Capital One Financial (COF) look ready to move higher into the end of the year. The short-term analysis of American Express (AXP) does allow for one more drop below the correction is completed.
For new positions, one has to consider the risk versus the potential reward. With the next upside targets for MA in the $487.60 area, buying at $436 and risking 5% to 6% does not make sense.
COF does look more interesting near current levels.
How to Profit: For Capital One Financial (COF), go 50% long at $55.72 and 50% long at $54.78, with a stop at $52.69 (risk of approx. 4.6%).
For American Express (AXP) go 50% long at $53.74 and 50% long at $51.84 with a stop at $50.44 (risk of approx. 4.4%) Cancel if $59.20 is hit first.
For MasterCard (MA) go 50% long at $426.28 and 50% long at $423.48 with a stop at $399.12 (risk of approx. 6%).


